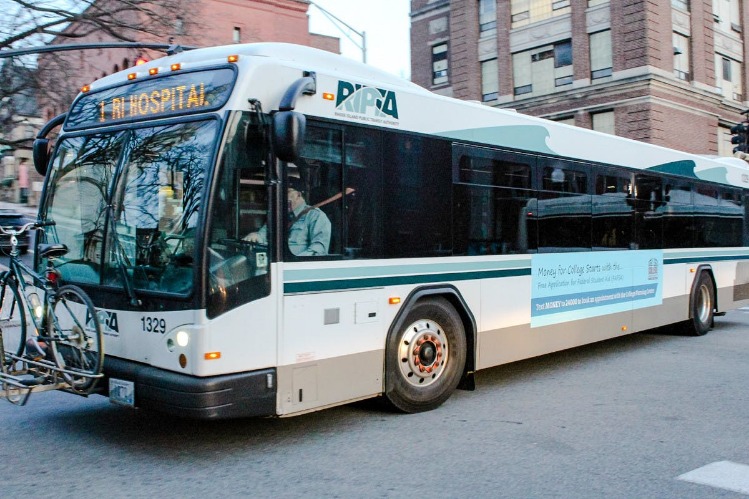

Overview of bus advertising in South Africa
South Africa’s bus advertising market offers a high-visibility platform for brands seeking urban reach across major cities such as Johannesburg, Cape Town and Durban. Advertisers can choose exterior formats—full or partial vehicle wraps, side panels and banners—or interior options like seatbacks and cabin posters to capture captive commuters. Rates and availability vary widely by city, route, bus type and contract length, with pricing typically structured by format and duration and often negotiable through fleet owners or media agencies. For campaigns aiming at urban corridors and mass-market exposure, bus advertising provides steady impression potential with the advantage of repeated daily exposure in a relatively affordable package compared with other outdoor media.
Definition and formats
Bus advertising in South Africa is a form of out-of-home advertising that places brand messages on the exterior and interior of public buses to reach urban commuters and passersby as the vehicles move through busy city streets.
Definition and formats: It is a channel that uses moving vehicles as canvases for campaigns. Formats include exterior wraps (full or partial) that cover sides, the rear, or the entire bus; exterior banners and panels; interior formats such as seat-back cards, ceiling banners, and wall panels; and, in some fleets, onboard digital screens. Each format offers different visibility, duration, and audience reach depending on route and traffic patterns.
Market scope in South Africa: Bus advertising reaches high-density urban areas where daily commuting is concentrated. Campaigns often run through private operator networks and municipal fleets across major metros, allowing brands to target specific routes or time windows (such as peak commute hours). The effectiveness hinges on route selection, bus frequency, and the overall campaign duration.
Rates and pricing models: Rates in South Africa are typically quoted per bus per month or per impression, with large-format exterior wraps commanding higher prices than interior panels. Pricing varies by city, operator, bus type, format, and campaign length. In general, interior ads tend to be more affordable than exterior wraps, and full bus wraps represent the premium option. Production, installation, design, permits, and maintenance are commonly additional costs to consider. Exact quotes are best obtained from advertisers or bus operators in the target region.
Format and cost guidance: Typical ranges (indicative) depend on format and location. Small interior panels or seat-back cards may sit at the lower end of the scale, while exterior wraps and prime-route placements in large cities can reach higher price points. Campaigns across several buses or fleets may qualify for volume discounts or bundled packages. Always confirm what is included in the quoted price, such as design, production, installation, and any ongoing maintenance.
Planning a bus advertising campaign in South Africa: Define objectives and audience, choose routes with high footfall or specific demographic reach, select the most suitable format, request formal quotes from multiple operators or agencies, review contracts for duration, coverage, and creative specs, align production and permit timelines, and set up metrics to track performance and optimize the campaign over time.
Bus advertising offers a moving, high-visibility channel in South Africa for brands seeking reach among urban commuters, with a range of formats and pricing that vary by city, format, and campaign length.
Key benefits for brands
Overview of bus advertising in South Africa: Bus advertising leverages the extensive urban transit networks across major South African cities to deliver brands into the daily lives of commuters and shoppers. In cities such as Johannesburg, Cape Town, Durban, and Pretoria, bus fleets provide both exterior and interior advertising space, offering a flexible scale from single buses to multi-vehicle campaigns.
Formats commonly used include exterior wraps or partial wraps that cover sides, rear panels, and sometimes the whole vehicle, as well as interior options such as seatback cards, ceiling or wall panels, and floor decals.
Reach and audience: Buses travel through dense business districts and residential neighborhoods, capturing a steady flow of commuters during morning and evening peaks. The combination of geographic targeting and high-frequency exposure makes bus advertising effective for brand awareness and proximity marketing.
Campaign planning and targeting: Planning typically involves selecting routes with high footfall, aligning with target demographics, and setting flight durations that maximize impressions. Longer campaigns reduce unit costs and improve recall, while flighting around events or promotions can boost effectiveness.
Key benefits for brands: High visibility in urban environments, broad local reach, and strong frequency with repeated exposure. The ability to target specific neighborhoods or corridors improves relevance for local campaigns. Exterior wraps deliver high impact, while interior placements offer context when commuters are seated and attentive. Bundled with digital or other OOH formats, bus advertising can reinforce campaigns and improve overall recall.
Rates and pricing landscape: Rates for bus advertising in South Africa vary widely by city, operator, format, duration, and the number of buses included. Exterior wraps tend to be premium placements and interior posters more affordable, with pricing generally quoted per bus per month or per route segment and often bundled into multi-bus packages. Seasonal demand, route popularity, and the length of the booking period all influence pricing.
Estimating costs and planning a budget: Start by defining the target routes and the number of buses you want to include, then request quotes from bus operators or transit advertising agencies. Ask for estimated impressions, reach, and frequency and request case studies or references from similar campaigns.
Measuring impact and ROI: Effectiveness is typically assessed using impression estimates, reach and frequency, and, when possible, brand lift or sales data integrated with other channels. Many campaigns use cross-channel tracking to connect bus exposure with digital interactions or in-store visits.
Regulatory and practical considerations: Advertising on public transport must comply with local bylaws and operator guidelines. Some cities require permits or approvals, and there may be restrictions on content, size, and placement. Working with established operators or agencies helps navigate compliance and logistics.
Getting started in South Africa: If you are exploring bus advertising, connect with local transit advertising specialists or the bus operators directly to discuss formats, routes, and current rates. A professional can help design creative that suits exterior or interior placements and assemble a package tailored to your budget.
Factors influencing bus advertising rates in SA
Bus advertising rates in South Africa are driven by route coverage and exposure, with urban corridors in cities like Johannesburg, Cape Town, and Durban typically commanding higher prices due to larger commuter volumes. Pricing also hinges on ad format (static wrap vs digital), fleet type, campaign length, seasonality, production and clearance costs, and the ability to measure reach and demographics, along with regulatory constraints and inventory availability.
Vehicle type and wrap level (full vs partial)
Bus advertising rates in South Africa are influenced by several variables, notably the vehicle type and wrap level. Understanding these factors helps advertisers estimate cost and maximize impact across major SA markets.
- Vehicle type and reach: Full-size city buses deliver the widest exposure due to higher exterior surface area and longer dwell times at stops, while midibuses and coaches offer lower-cost options for targeted routes or regional campaigns.
- Wrap level and coverage: A full wrap covers the entire vehicle and commands a premium, but a partial wrap or panel wrap is cheaper and can be effective on high-traffic corridors if design emphasizes key messaging.
- Route, location, and rider demographics: Rates vary by city and route; urban hubs in Gauteng, Western Cape, and KwaZulu-Natal typically command higher prices due to larger passenger volumes and higher brand visibility opportunities.
- Fleet operator status and inventory control: Contracts with large operators or exclusive route rights can influence price and availability; predictable inventory helps negotiators achieve better terms.
- Campaign duration, timing, and seasonality: Longer campaigns often unlock volume discounts; rates can peak during holidays, major events, or tourism peak seasons when rider traffic is higher.
- Production, installation, and maintenance costs: Materials (vinyl, lamination), printing complexity, and installation labor affect upfront costs; ongoing maintenance and refresh cycles add to total cost over the campaign.
- Regulatory environment and permits: Local bylaws, advertising approvals, and permit fees can affect the time to launch and total cost; some cities restrict wraps or require compliance checks.
- Creative design quality and messaging effectiveness: Clear, high-contrast designs with succinct copy improve recall and perceived value; poor design can reduce return on investment regardless of rate.
- Market demand, inventory competition, and seasonality: Availability of prime fleet assets fluctuates with operator schedules and competing campaigns; discounts may apply when demand is soft or inventory is abundant.
- Digital vs static options and integration: Some fleets offer digital display panels or dynamic content, which typically carry higher rates but enable rotation and up-to-date messaging; coordination with other media can improve overall ROI.
Route reach and geographic coverage
Bus advertising rates in South Africa are influenced by route reach and geographic coverage, as well as ad format, campaign duration and market demand. Rates vary by city and network, with major metros typically commanding premium due to higher commuter exposure.
- Route reach and network size: Larger fleets and more routes deliver more impressions, often commanding higher rates, especially in metros like Johannesburg, Cape Town, and Durban.
- Geographic coverage and city dynamics: Urban centers with dense population and high footfall raise prices, while rural or regional routes tend to be more affordable but offer lower reach.
- Ad format and inventory type: Full wraps and exterior side panels usually fetch top-tier rates, whereas interior posters or smaller panels are cheaper; digital boards, where available, can carry premium due to dynamic rotation.
- Campaign duration and flighting: Longer commitments or multi-month bookings often secure lower monthly rates; short-term runs tend to be priced higher on a daily basis.
- Scheduling and timing: Rates rise during peak travel periods, holidays, major events, and in business districts during rush hours when exposure is highest.
- Operator network quality and reliability: Established networks with strong coverage and on-time performance tend to command higher prices than smaller or fragmented fleets.
- Visibility and placement on high-traffic corridors: Ads on main arteries, interchanges, and bus stops with high passenger turnover usually attract premium CPMs.
- Production, installation, and maintenance costs: Artwork design, vinyl installation, and ongoing replacements add to the overall cost; bundles or long-term deals can mitigate per-impression expenses.
- Regulatory environment and permits: Municipal regulations, permit fees, and safety requirements can influence upfront costs and scheduling flexibility.
- Target audience and demographics: Campaigns targeting dense commuter flows, tourists, or high-value districts may command higher rates due to expected engagement.
- Demand, competition, and market dynamics: Limited inventory on popular routes or during busy seasons can push prices up as demand tightens.
- Pricing models and value packages: Common structures include flat rates, CPM-based pricing, and bundled packages with other media; longer contracts often yield discounts.
- Digital versus static inventory: Digital bus signage (where available) typically offers dynamic rotation and higher rates, while traditional static wrap or panel ads remain the standard option in many networks.
- Measurement, attribution, and reporting: Advertisers look for impressions, reach, and frequency estimates; transparent reporting can influence willingness to pay and negotiations.
Seasonality and campaign duration
Bus advertising in South Africa offers broad urban reach across major markets, with campaigns often leveraging exterior wraps, interior panels, and digital signage on fleets in cities like Johannesburg, Cape Town, and Durban. Rates show significant variation based on where the buses operate, the type of media, and how long the campaign runs, making strategy and planning essential to maximize impact.
Several factors influence bus advertising rates in SA. Network coverage and route density are primary drivers: more buses on high-traffic corridors with large daily passenger volumes command higher rates. The ad format matters too—exterior wraps and large exterior panels typically cost more than interior screens or standard interior panels. Vehicle type (standard buses vs premium fleets), fleet size, and the number of advertisers sharing the same bus also affect price. Geography plays a role, with Gauteng generally carrying higher rates than some other regions due to denser populations and higher demand. Digital signage, dynamic or video content, and seasonal creatives can add premium pricing versus static placements.
Seasonality significantly impacts pricing and availability in SA. Demand tends to rise during the festive season from November to January when retail activity and travel spike, followed by post-holiday periods. Major events such as international conferences, sports tournaments, or regional festivals can create temporary spikes in inventory demand and elevate rates. Tourism peaks in certain months also influence pricing, as fleets in tourist-heavy corridors experience higher demand. Weather patterns and school holidays can also shift when advertisers compete most aggressively for attention on busy routes.
Campaign duration is a key lever for negotiating cost per impression and overall spend. Shorter campaigns often incur higher CPMs and may come with limited inventory and less favorable long-term discounts. Longer campaigns typically unlock volume discounts, more favorable weekly rates, and greater creative consistency across time, which can improve brand recall. The booking lead time matters as well: longer lead times allow media owners to bundle inventory across routes or cities, potentially yielding bundled savings or added value like enhanced rotation or targeted timing around seasonal peaks.
Seasonality and campaign duration interact to shape pricing dynamics. For example, a creator running a two-month front-loaded campaign around a major shopping event may encounter higher daily rates with tighter inventory, while a six- to twelve-month program could secure better overall pricing and cross-route placements. Advertisers who align campaigns with high-traffic periods and commit to longer durations often gain leverage in negotiations, especially when combined with complementary media such as in-transport or outdoor formats in the same market.
To optimize bus advertising spend in South Africa, plan around peak corridors and high-demand periods, consider a mix of exterior and interior placements, and explore digital options where available for dynamic frequencies. Booking early, negotiating bundled packages across multiple routes, and aligning duration with campaign goals can help secure more favorable pricing and stronger campaign performance without compromising reach.
Creative specs and production costs
Bus advertising in South Africa offers broad reach across major cities and urban corridors, but rates vary widely based on where the buses operate, the type of inventory, and the duration of the campaign. Advertisers seek maximum visibility on routes with high passenger volumes and strong daily traffic, while operators price inventory to reflect demand, fleet size, and route premium.
Several core factors influence pricing. Route density and geographic reach are paramount: central business district and high-traffic urban routes typically command higher rates due to greater exposure to a diverse and captive audience. The size and composition of the operator’s fleet, along with the number of buses included in a campaign, also affect pricing, with bigger fleets offering better bulk value. The chosen inventory type matters as well—full wraps fetch premium pricing, followed by partial wraps, side panels, rear panels, and interior placements, each with a distinct level of exposure and durability considerations.
Creative formats and on-bus media options influence both cost and impact. Static wraps and exterior signage occupy prime visual real estate and tend to cost more than interior posters or decals. Some operators now offer on-board digital displays or e-paper panels, which can carry dynamic creative; these formats typically command a premium but allow updates without reprinting. Availability of digital or mixed-format inventory varies by city and operator, affecting overall rate cards and the ability to run time-specific or event-driven campaigns.
Campaign duration and timing are key levers. Long-term commitments often unlock volume discounts or bundled pricing across multiple routes or fleets. Seasonal demand, such as holidays or major events, can drive peak pricing due to temporary scarcity of premium space. Time-of-day exposure matters as well; prime commuting hours may carry higher rates than off-peak windows, reflecting the heightened audience reach during those periods.
Regulatory and operational considerations also shape pricing. Advertising permits, municipal approvals, and safety regulations can create lead times and cost implications for creative design and installation. Certain routes or vehicle types may have restrictions on content, color, or placement to ensure safety and vehicle identification remains clear. Insurance requirements, maintenance windows, and the need to transition vehicles in and out of service for wraps can introduce ancillary costs and affect campaign continuity.
Market dynamics and bargaining power play a role in negotiated rates. The mix of operators in a city, competition among agencies, and the advertiser’s ability to commit to multiple routes or cities can influence discounting. When demand is tight or inventory in a high-value market is limited, per-bus and per-impression pricing tends to rise. Conversely, in markets with larger fleets and broader coverage, advertisers may secure more favorable rates through volume deals and longer contracts.
Creative specs for bus wraps and exterior advertising are essential to ensure the artwork delivers the desired impact. Designers typically work in CMYK color space with delivery files in vector or high-resolution raster formats; common file types include AI, EPS, PDF, and TIFF. Practical guidelines emphasize bold typography, high contrast, and large, legible text that remains readable from a distance. Safe zones are critical to avoid content being trimmed by edges or hardware; fluids and façades on wraps require margins well outside the trim area and sufficient bleed. Articles should avoid complex gradients or fine details that may degrade on large-format print or curved surfaces, while maintaining brand consistency and legibility under various lighting conditions.
Production costs cover more than printing. Artwork and design fees may be charged separately or bundled into a package. The print and install phases comprise high-quality vinyl wrap materials, lamination for weather resistance, and a careful installation process to avoid air pockets or edge lifting. In South Africa, costs for a full vehicle wrap include design, production, and on-site installation, with typical pricing varying by bus size, wrap complexity, and the number of surfaces to cover. Partial wraps and interior signage generally incur lower costs, while maintenance and occasional touch-ups are ongoing considerations during the campaign’s life cycle. Turnaround times from final art approval to installation can range from a few days to several weeks, depending on scheduling and regulatory clearance.
Creative best practices emphasize consistency with brand guidelines, clear calls to action, and measurable impact. For on-bus campaigns, simplicity and readability are paramount; messaging should leverage the vehicle’s movement and frequent exposure to reinforce recall. When possible, pairing exterior creative with interior messaging can extend engagement, while considering a multi-channel approach across radio, digital, and out-of-home networks to maximize reach. If digital on-board screens are available, dynamic creative can be used to align with time of day, weather, or live events, though this may require additional production planning and higher ongoing costs.
In summary, bus advertising rates in South Africa are shaped by route performance, fleet availability, and the type of inventory selected, with premium pricing for full wraps on high-visibility routes and discounts for longer commitments or larger bundles. Creative specs and production costs hinge on print quality, installation complexity, and regulatory compliance, while effective campaigns balance strong visual design with practical considerations for readability, safety, and measurability. Advertisers should work with experienced suppliers who can align geographic reach, budget, and creative strategy to maximize return on investment in the South African transit landscape.
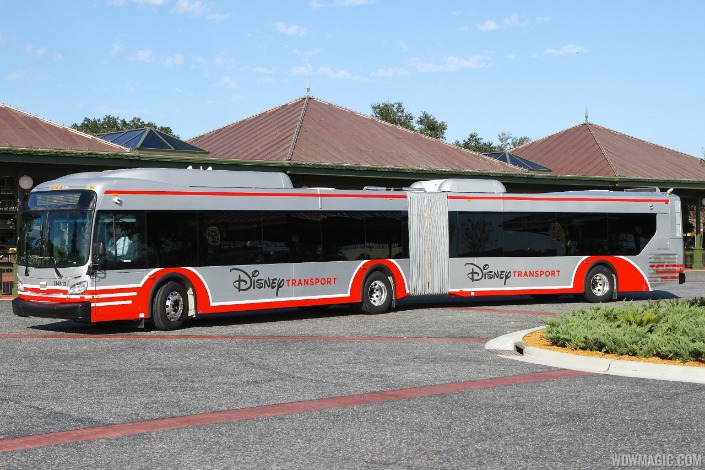
Pricing models used in SA bus advertising
Pricing models for bus advertising in South Africa blend time-based, space-based, and audience-based approaches. Advertisers can pay flat rates for a single bus, route, or city-day, or opt for package deals across multiple vehicles and routes. Impressions-based pricing (CPM) and reach-based pricing (CPP) are common, often adjusted by vehicle type (full wrap vs. panel), peak versus off-peak times, campaign duration, and geographic scope, with seasonal promos and negotiated discounts shaping the final cost.
Flat rate, CPM and other pricing methods
Pricing for bus advertising in South Africa is shaped by format, inventory and market demand across major cities such as Johannesburg, Cape Town and Durban. Advertisers choose from exterior wraps, interior panels, back-of-bus banners, and digital screens where available, with pricing typically set on a per-bus basis and tied to the duration of the campaign.
Flat rate pricing is the simplest approach, offering a fixed cost for a defined inventory over a set period. A brand may pay a monthly flat rate to wrap a bus or to place exterior panels on a selected route, with production and installation often included or billed separately. This model provides budgeting predictability and is popular for national campaigns or continuous visibility.
CPM, or cost per thousand impressions, is another common model. With CPM, advertisers pay a set amount for every thousand bus exposures, which are estimated from fleet size, route coverage, and typical daily visibility. Exterior wraps produce higher CPMs due to larger impact, while interior panels may be priced lower. Rates vary by city, route prestige, and inventory type.
Time-based rates are widely used, especially for short campaigns or tests. Daily and weekly pricing allow bookings by the bus for a number of days or by route for a fixed week. Minimum booking periods help ensure the inventory is used efficiently and provide predictable planning for both the advertiser and the media owner.
Location-based pricing reflects the value of visibility. Central business district routes, high-traffic corridors and event-heavy routes tend to command higher rates than peripheral or off-peak routes. Pricing may also vary by the time of day or day of the week to reflect audience concentration.
Volume and duration discounts are common in SA bus advertising. Agencies may offer reduced unit costs for longer campaigns, or bundle inventory across several buses or cities to achieve broader reach at a lower per-impression price. Negotiated packages can include cross-city coverage and multi-format mixes.
Production and installation costs are typically separate from media spend. This includes artwork, design, wrap fabrication, installation, and ongoing maintenance. Some quotes bundle these costs, while others bill them as one-off or at cost, so it’s important to clarify what is included in the agreement.
Digital bus advertising pricing can differ from static formats. Where digital screens exist, pricing may be dynamic or programmatic, with higher rates during peak hours or special events. Digital formats often support faster changes and A/B testing, and may be priced on CPM or as flat-rate bundles depending on the provider.
Measurement and guarantees vary by provider. Some offers include guaranteed impressions or frequency targets, with adjustments if targets are not met or bonuses if targets exceed expectations. Always confirm the measurement methodology, whether third-party verification is provided, and what incentives or penalties apply if targets shift.
When comparing offers, request a clear rate card, a detailed inventory list, city-specific pricing, average daily impressions, and a proposed flight schedule. Ensure you understand what is included in the price (production, installation, taxes) and whether discounts apply for longer terms or multi-bus buys. With these models, SA bus advertising can be aligned to fit budgets, reach, and campaign duration.
Discounts, bundles and long-term deals
Pricing for bus advertising in South Africa varies by operator and format, with common models including flat-rate, per-panel pricing, CPM-based approaches, and bundled packages. Rates are influenced by route popularity, urban density, contract length, and the mix of formats chosen to achieve campaign goals.
- Flat-rate pricing per bus per day or per month: A straightforward charge for a defined time period, often used for exterior wraps or full-bus campaigns, with higher rates for premium routes or peak times.
- Per-panel or per-format pricing: Fees assigned to specific areas such as exterior sides, rear, front, or interior panels; different panels and wrap styles carry different price points.
- CPM (cost per thousand impressions): Pricing based on estimated audience reach, useful for campaigns aiming to maximize exposure across high-traffic routes; rate depends on rider volumes and route intensity.
- Route or geography-based pricing: Rates tied to the coverage area (e.g., central business district vs. suburban routes) and the number of buses or routes included in the buy.
- Time-based packages (daily, weekly, monthly, quarterly): Flexible durations that let advertisers scale exposure, with longer commitments typically earning discounts.
- Bundled packages and multi-format deals: Combined buys that include exterior wraps, interior panels, and rear panels, or cross-format bundles with other transit or out-of-home media for greater reach.
- Long-term contracts and loyalty discounts: Price locks and reduced rates for multi-month to multi-year commitments, often accompanied by renewal incentives.
- Seasonal and promotional discounts: Short-term offers aligned with holidays, events, or slower advertising periods to boost campaign momentum.
- Production and installation fees: One-time charges for creative development, file preparation, printing, and the physical installation or removal of wraps and mounts.
- Payment terms and flexibility: Options for upfront payment, staged payments, or milestone-based schedules, sometimes with discounts for early settlement.
- Performance-based or guaranteed impressions (less common): Some operators may offer guarantees or add extra inventory if targets aren’t met, typically within negotiated contracts.
Typical rate ranges by format in South Africa
In South Africa, bus advertising rates vary by format: full wraps are the most expensive, semi-wraps and side-panel ads fall in the mid-range, rear-panel and interior placements are more affordable, and seatback or single-panel options are the lowest cost. Monthly prices typically span from a few thousand rand for interior or single-panel ads to the high five- or six-figure range for a full-wrap campaign, depending on city, operator, duration, and audience reach.
Bus wraps and full vehicle campaigns
Bus advertising rates in South Africa vary by city, fleet size, duration, and format. This overview provides typical rate ranges for two common formats: bus wraps and full-vehicle campaigns.
Bus wraps: For a single bus exterior wrap in major markets (e.g., Johannesburg, Cape Town), monthly rates commonly range from about R60,000 to R180,000. Partial wraps or door-to-door wraps can be lower, roughly R25,000 to R80,000 per month. Production and installation costs are extra and can add roughly R5,000 to R20,000 per bus depending on design complexity.
Full-vehicle campaigns: When a campaign covers multiple vehicles or an entire fleet, monthly costs scale with fleet size and city. Typical ranges might be roughly R150,000 to R600,000 per month for a small to mid-sized fleet in a single city, and R1,000,000 to R3,000,000 per month for larger fleets or multi-city campaigns. These figures often exclude creative development, production, and logistics, which can add to the total.
Exterior bus banners and signage
Interior bus advertising
Typical rate ranges for interior bus advertising in South Africa vary by format, city, operator size, and campaign length. This overview focuses on common interior formats used on urban and intercity buses and provides approximate monthly price ranges per bus to help planners budget and compare options.
Seatback cards inside seat pockets are among the more affordable interior formats. Typical ranges are about R1,500 to R4,500 per bus per month, depending on the bus’s route, seating layout, and whether the campaign cycles through multiple pages. Shorter weekly blocks may start around R500 to R1,500 per bus.
Interior aisle banners and end-of-row banners tend to sit in the mid-range. Typical ranges are approximately R2,000 to R6,500 per bus per month. Premium routes, high-demand corridors, or larger fleets can push rates higher, while smaller operators or less-trafficked routes may fall on the lower end.
Ceiling banners and overhead interior placements also fall in the mid-to-upper range, with typical ranges of R2,500 to R7,500 per bus per month depending on visibility, whether the banners span multiple sections of the bus, and the length of the campaign.
Interior poster panels or side-wall panels with larger visuals generally command between R3,000 and R9,000 per bus per month. The exact price depends on the number of panels used per bus, printing quality, and whether the ad is updated periodically during the campaign.
Floor decals and interior floor graphics offer another interior option, usually priced around R1,200 to R3,500 per bus per month. These require durable materials and safe placement to avoid wear and slipping, which can influence cost and duration of the run.
Digital interior screens, where available, are less common on standard bus fleets but can be offered on higher-end or specially equipped buses. Rates for digital interior formats typically range from R10,000 to R40,000 per bus per month, depending on screen size, resolution, content rotation, and audience reach.
Fleet discounts and contract length can significantly affect the final price. Suppliers may offer 15% to 30% discounts for 20 or more buses, and longer commitments (6–12 months) can yield additional reductions beyond base rates. Conversely, shorter or randomized placements may be priced at the top end of these ranges.
Campaign duration and geographic location influence price as well. Monthly campaigns are generally more cost-effective on a per-week basis than shorter blocks, and major metropolitan areas such as Johannesburg, Cape Town, and Durban typically command higher rates due to greater pass-through and audience density, while rural or smaller-city routes may be more affordable.
Notes: These ranges are indicative and exclude production costs such as design, printing, lamination, or installation. Artwork setup, proofs, and replacement panels are often charged separately. Always request a formal rate card from the operator or media owner to confirm current prices and any package inclusions.
To plan effectively, request detailed media kits from multiple operators, compare rate cards, check audience reach and average daily ridership, and consider mixing interior formats across routes for optimal coverage and frequency within budget.
Regional differences and networks in South Africa
Regional differences in South Africa shape bus advertising rates through the size and composition of local transit networks. In major metros such as Gauteng, the Western Cape, and KwaZulu-Natal, dense city buses and BRT corridors carry high commuter volumes, driving premium pricing and broad reach. By contrast, rural provinces and smaller towns with sparser services offer lower rates but targeted access to localized audiences and longer route coverage on intercity and minibus taxi networks. Understanding the network mix—city fleets, BRT routes, and long-distance or informal transport links—helps advertisers plan regional campaigns aligned with peak travel times and regional travel patterns.
Major cities and operator networks (Gauteng, Western Cape, KwaZulu-Natal)
Bus advertising rates in South Africa vary by region, driven by network structure, ridership, and media inventory. This article outlines regional differences and networks in Gauteng, Western Cape and KwaZulu-Natal, focusing on major cities and the operator landscape to help plan regional campaigns.
Gauteng is the economic hub and has the densest and most complex bus network in the country. The two largest metros are Johannesburg and Pretoria (Tshwane). In Johannesburg, the Rea Vaya bus rapid transit (BRT) network is the flagship system, serving inner-city corridors and key feeders. Pretoria is serviced by the A Re Yeng BRT network, which connects major north-south routes. Beyond these BRT schemes, a large private operator market serves high-frequency trunk routes and suburban feeders, including long-standing operators such as PUTCO and various smaller operators. Advertising on Gauteng buses tends to command premium in high-ridership corridors because of peak volumes and dense street-level exposure, while interior ads along busy routes benefit from long dwell times at key stops.
Western Cape’s major city is Cape Town, where the MyCiTi BRT network provides a modern, city-wide backbone with a defined core system and feeders that reach major residential and business districts. Golden Arrow Bus Services (GABS) operates a substantial and long-standing route network within the metro and into surrounding areas. Intercape and other private operators also run regional and intercity services from Cape Town to other provinces. In this region, MyCiTi offers premium exterior and interior advertising opportunities on a modern fleet, with strong visibility on central corridors, while GABS routes support broader reach across the metropolitan area and into suburban communities.
KwaZulu-Natal centers on Durban and Pietermaritzburg, with a mixed network of municipal services and private operators. Durban’s urban transit ecosystem includes a combination of city-supported routes and private operators that feed into the main corridors along the coast and through the northern suburbs. Pietermaritzburg and surrounding towns rely on similar blends of municipal and private operators for both commuter and feeder services. Intercity operators such as Intercape and other regional players provide longer-distance coverage from KwaZulu-Natal to neighboring provinces. In this province, bus advertising tends to perform well along dense commuter corridors and in areas with high pedestrian traffic near major stops and transfer hubs.
Regional differences in networks influence advertising rates and inventory. High-density corridors with concentrated ridership and frequent stopping points typically command higher rates due to greater exposure and repetitive impressions. The mix of municipal, BRT, and private operators affects inventory availability, with premium formats (full or partial bus wraps, exterior panels on high-visibility routes, and interior seat-back cards) often priced higher in Gauteng and Western Cape than in some KwaZulu-Natal corridors where supply may be more fragmented. Digital screens are less common but are being piloted on select fleets, contributing to variable pricing depending on fleet modernization and route performance.
Formats and inventory commonly offered across these regions include exterior wrap and partial wrap, exterior banners on the sides and rear, interior seat-back cards, and hanging or pole banners at stops. In Cape Town, MyCiTi and GABS fleets provide a mix of modern and traditional ad spaces, while in Gauteng, Rea Vaya, A Re Yeng, and private operators offer a combination of interior and exterior options with strong exposure on peak commute routes. In KwaZulu-Natal, advertisers typically access a mosaic of formats across Durban and Pietermaritzburg routes, with emphasis on high-traffic corridors and transfer hubs wherever inventory is available.
Practical planning tips for advertisers: start with the region that best matches your target audience and campaign goals, then align with the relevant operator networks (Gauteng’s BRT corridors and private fleets; Western Cape’s MyCiTi and GABS routes; KwaZulu-Natal’s Durban-Pietermaritzburg corridors and intercity links). Request route-level ridership data and stop density from operators or regional media planners, run small test campaigns to gauge impressions, and consider a mix of formats to balance reach and cost. Finally, coordinate cross-regional campaigns to maximize reach across the national commuter footprint while tailoring creative and formats to each network’s characteristics.
National vs regional reach
Bus advertising rates in South Africa are shaped by regional differences and the networks that operate on city streets and bus corridors. Brands that want broad awareness must navigate a mix of national networks and city or province specific opportunities, where audience reach, route choice and contract length all affect price.
National bus advertising networks offer coverage across multiple metros and regional hubs, typically delivering consistent formats such as exterior wraps or standard interior boards on a large scale. In contrast, regional networks focus on a single city or province, often targeting high-traffic corridors, core commuter routes and peri-urban feeders where the majority of daily passengers travel.
Format and placement are major drivers of cost. An exterior bus wrap or full bus takeover commands the highest rates, followed by interior panels and back-panel ads. Less expensive options include single posters inside the bus, seat-back cards, or digital panels where available. In South Africa, the availability of digital bus advertising is growing but remains concentrated in major networks and larger cities.
Regional differences also influence audience characteristics and language choices. In English-dominated metropolitan ads, English copy with concise calls to action is common, while bilingual or location-specific language variants are used to connect with local riders in areas where isiZulu, isiXhosa, Afrikaans or Northern Sotho are prevalent. For national campaigns, English often serves as a unifying language, with supplementary local language versions where appropriate.
Rates are driven by route reach, peak travel times and the length of the campaign. Prime city-center corridors, long daily routes and exclusive contracts in busy nodes typically command higher prices. Discounts are frequently offered for longer commitments (quarterly or yearly), bundled networks, or multi-format campaigns (wrap plus interior boards across several buses).
Choosing between national and regional reach depends on marketing goals. A national network suits brands seeking broad awareness across Gauteng, the Western Cape, KwaZulu-Natal and beyond, while regional networks are effective for city-specific launches, event sponsorships or targeting particular commuter patterns. Measurement usually relies on impression estimates provided by operators, aided by footfall studies and, where possible, independent research or third party analytics.
To get a sense of current bus advertising rates in South Africa, request quotes from a few reputable operators and compare formats, route coverage, contract lengths and added value such as digital placements, creative rotation or in-bus data integrations. While rates are not fixed, understanding regional reach and network strengths helps planners optimize spend and achieve the desired balance of reach and relevance.
Audience reach and targeting opportunities
Bus advertising in South Africa offers broad audience reach across urban and commuter routes, with strong targeting opportunities based on route selection, time of day, and audience demographics. Advertisers can tailor messages to English-speaking commuters, optimize campaigns on high-traffic corridors in major cities, and use language and creative nuances to maximize relevance. Understanding bus advertising rates in South Africa helps balance scale and cost, delivering efficient exposure to shoppers, workers, and travelers.
Demographics by route and time of day
Bus advertising rates in South Africa offer broad audience reach across major cities and transit corridors, with opportunities to target specific demographics by route and time of day. Understanding who sees the ads and when helps optimize budgets and improve campaign effectiveness.
Audience reach is driven by high daily impressions along urban corridors, transfer hubs, and routes linking residential suburbs with central business districts and campuses. Exterior wraps deliver strong visibility to pedestrians and motorists at busy stops and along busy roads, while interior panels reach riders during longer dwell times.
Demographics by route vary with geography. Routes through the central business districts attract employed professionals, students, and urban shoppers, often with higher mobility and disposable income. Suburban routes toward residential areas typically reach families and commuters, while routes serving university areas skew younger and more educated. In many cities, routes into townships or peri-urban zones reach a mix of workers and students, offering broad mass reach.
Time of day shapes who you reach. Morning peak periods (roughly 6 to 9 a.m.) and evening rush hours (roughly 4 to 7 p.m.) concentrate commuters, increasing impressions within business districts. Midday periods capture shoppers, service workers, and students between classes. Weekends can shift toward leisure travelers and tourists in coastal or entertainment zones, with different route priorities in tourist-heavy regions like Cape Town or Durban.
Rates vary by format, route popularity, and campaign length. Exterior wraps and large side panels on high-traffic routes command premium rates, while interior panels and shorter runs on secondary corridors are more affordable. Rates also differ by metro: major metros such as Johannesburg, Cape Town and Durban typically show higher price points than smaller towns, reflecting higher impressions. Some operators offer rate cards based on cost per thousand impressions (CPM) or flat daily rates, with discounts for longer commitments.
Targeting opportunities arise from pairing route choice with local demographic insights. For example, select routes near universities and business districts to reach young adults and professionals during commute hours, or combine suburban routes with shopping centers to reach families during midday periods. Using multiple routes across a metropolitan area increases reach and helps balance frequency.
Measurement and optimization in bus advertising come from operator-reported impressions and, where possible, store visits or digital uplift tied to campaigns. Market data, route maps, and dwell-time estimates from operators help forecast potential reach before booking. Aligning with tactical seasonal windows, such as university terms or holiday shopping seasons, can improve ROI.
Contact a local bus advertising specialist or operator to obtain current rate cards, route-by-route reach data, and creative formats that suit your target demographics and budget in South Africa.
Frequency, dwell time and visibility metrics
Bus advertising in South Africa offers broad audience reach across major cities and the opportunity to target commuters through route selection, time slots, and vehicle types. Understanding audience reach, targeting options, frequency, dwell time, and visibility metrics is essential for evaluating rates and optimizing campaigns.
- Audience reach and targeting opportunities: Target by city and route to align with commuter flows in Johannesburg, Cape Town, Durban, and other metros. Choose routes with high footfall or strategic corridors (business districts, shopping hubs, campuses) and select vehicle types (standard, articulated, or BRT networks) for exterior and interior placements. Use time-of-day slots (morning/evening peaks), multilingual messaging, and proximity to transit hubs to refine reach. Complement transit ads with nearby retail or digital boards to extend exposure and improve targeting accuracy.
- Frequency: Measure frequency as impressions per period and design campaigns to balance repetition with fatigue. Achieve consistent exposure by rotating creatives across multiple routes, using both exterior and interior placements, and potentially layering with digital transit assets. Factor in seasonality and traffic patterns to maintain a steady pace that supports recall without oversaturation.
- Dwell time and visibility metrics: Dwell time reflects how long a viewer is exposed to an ad. Exterior bus ads experience short dwell times as buses pass on roads, while interior ads can benefit from longer exposure during rides. Visibility factors include legibility, distance from the viewer, contrasts, and clutter. Track metrics such as estimated dwell time per route, viewability, and readability, using route data and field tests or third-party measurements to infer impressions and effectiveness.
- Rates, measurement and how metrics influence pricing: Rates for South African bus advertising vary by city, route popularity, bus type, and placement (exterior vs interior) and by campaign duration. Pricing is often quoted per bus per month or per route bundle, with discounts for longer commitments or multi-route packages. To compare offers, translate quotes into CPM using estimated route impressions, and request consistent measurement of reach, frequency, dwell time, and visibility so pricing reflects potential ROI. Consider bundling with nearby transit assets or digital equivalents to maximize value.
Creative and production considerations
Creative and production considerations underpin how bus advertising rates in South Africa translate into real impact, balancing bold visuals with practical constraints such as printing methods, material durability, and installation logistics. Effective campaigns pair concise messaging, legible typography, and scalable artwork with the rate card and route strategy to maximize reach on urban bus networks.
Design guidelines for bus advertising
Bus advertising in South Africa offers high-visibility reach in major cities and along key commuter corridors. To maximize impact, start with strong creative and clear production considerations that align with local rates, fleets, and permit processes. A well-planned approach helps ensure your message breaks through quickly and remains legible from a moving vehicle.
Understand the typical formats available and how they influence both design and pricing. Exterior formats include full wraps that cover the entire bus, partial wraps that cover sides or rear, and single panels such as the rear or side banners. Interior formats include seatback panels and overhead or bulkhead ads. Each format carries different production costs and exposure levels, which in turn affect your overall campaign rate and carve-out for artwork and installation.
Creative considerations should prioritize readability and recall. Use bold headlines, a single strong visual, and minimal copy to maximize legibility at speed and from a distance. Favor high-contrast color pairs and a large, legible sans serif font. Limit the message to essential information: brand, a clear value proposition, and a simple call to action. Avoid dense blocks of text and ensure imagery remains sharp when scaled to large sizes and viewed in bright sunlight common in SA climates.
Design guidelines differ by format. For full wraps, plan a clean visual hierarchy that guides the eye from the brand mark to the call to action across the bus silhouette. For partial wraps and panels, allocate the most impactful area to the core message and keep critical elements away from doors, emergency exits, and windows to avoid obstruction. Interior ads should consider the close-distance reading context and avoid obstructing passenger signage. Always include a safe zone around edges and avoid placing important elements near seams or fold lines.
Production considerations address durability and finish. Use durable vinyl or wrap materials rated for UV exposure and high city temperatures, with a robust laminate to resist fading and wear from weather and grit. Provide high-resolution artwork in vector where possible, with fonts embedded or outlined, and deliver print-ready files in CMYK. Confirm color proofs with the printer and obtain a test print to verify contrast and legibility before full production. Plan for installation logistics, including vehicle access, fleet downtime, and post-installation inspection for bubbles or misalignment.
Budgeting and rates for SA campaigns depend on fleet size, city, format, and campaign duration. Common models include per-bus monthly rates for wraps, per-route or per-week pricing for panels, and CPM-based structures for broader reach. Production and installation are typically separate line items, and there may be set-up fees for artwork validation, lamination, or engine-off servicing. In major SA markets, expect higher rates for full wraps on popular routes versus interior posters on smaller fleets, with longer campaigns often securing better value through volume discounts.
Regulatory and permit considerations should not be overlooked. Outdoor advertising in South Africa is governed by municipal by-laws that can affect display locations, sizes, and content. Secure the necessary permits and ensure compliance with local rules regarding political or sensitive messaging, protection of residents’ rights, and safety around bus operations. Work with a local agency or media owner who understands city-specific requirements to streamline approvals and avoid campaign delays.
Practical design tips for success in South Africa include using culturally resonant visuals and inclusive language in English, the dominant business language in many urban campaigns. Test variations of headlines and imagery on mockups to evaluate legibility under sun glare and at typical viewing distances. Prepare multiple asset sizes for different formats and deliver a cohesive look across fleet types. Finally, build in time for proofs, production holds, and installation windows to keep campaigns on track with seasonal advertising calendars.
When estimating ROI, factor in the expected impressions per bus, route frequency, and the average dwell time of viewers at stops and in traffic. Combine bus ads with complementary media in a broader OOH plan to extend reach and reinforce the message. By aligning creative clarity, robust production specs, and compliant deployment with realistic rate expectations, a bus advertising campaign in South Africa can deliver strong visibility and a compelling return on investment.
Materials, durability and environmental factors
Bus advertising in South Africa offers a high-visibility channel across major urban hubs, and when planning a campaign the interplay of creative and production decisions, materials, durability and environmental factors all shape reach, impact and cost.
Creative considerations include legibility at speed, contrast for daytime and night viewing, and branding that works on curved bus surfaces. Designs should avoid congested text, use bold type, modular layouts, and keep critical elements near dominant viewing angles. It is also important to comply with safety regulations, respect window and door clearances, and tailor artwork to the geography and routes where the buses operate.
Production considerations cover choosing between a full vehicle wrap, partial wraps, or interior/poster formats, plus the workflow from concept to install. This includes color management and proofing, choosing printable media, selecting protective laminates, and planning for installation logistics, scheduling around bus depots and routes, and potential downtime of vehicles.
Materials used for outdoor bus ads in SA typically include cast vinyl wraps with weathering-rated adhesives and UV-resistant laminates. The choice between removable and permanent adhesives, the thickness of the film, and the laminate layer influence durability and clean removal later. For interiors, paper posters or display panels may be used with mounting hardware designed for high traffic and vandal resistance.
Durability and environmental factors in South Africa affect performance. Strong sun exposure, high temperatures, dust, rain and frequent cleaning can fade colors, cause edge lifting or micro-cracking, and shorten life if the wrong laminate or adhesive is used. Vendors typically specify expected lifespans for different formats, and maintenance plans should cover routine washing and prompt repairs to prevent detachment.
Rates and budgeting are driven by vehicle type, city, route reach, campaign duration, and creative complexity. Costs generally break down into creative development, production (printing, laminating, trim work), and installation, with ongoing charges for maintenance, repaints or refurbishments if applicable. Larger fleets, longer durations, and campaigns across multiple cities can secure volume pricing, while premium routes or high-visibility buses in peak periods may command higher quotes.
Environmental considerations include choosing inks and materials with lower environmental impact where possible, selecting recyclable or remnant materials, and ensuring end-of-life disposal is feasible. Many providers offer UV-stable inks with reduced VOCs and recyclable vinyl options; it is prudent to ask about supplier certifications and the environmental policy of the creative and production partner.
Practical tips for advertisers planning South African bus campaigns: gather multiple quotes, review the sample proofs against route exposure and readability, confirm lead times for production and installation, check warranty terms for wrapped surfaces, and align the creative brief with the operator’s depot schedules to minimize downtime and maximize city-wide reach.
Production timelines and validation
When planning bus advertising in South Africa, creative and production considerations, production timelines and validation play a central role in translating rates into effective reach. Rates vary by fleet size, route mix, and ad format (full-wrap, rear, side panel, or interior), so creative decisions must align with the budget and the audience you want to reach.
Creative should maximize legibility at speed, with bold typography, high-contrast color, and concise messaging. Consider multilingual needs (English with local languages where appropriate) and brand consistency across campaigns. Ensure the design doesn’t obscure safety features, windows, doors or emergency exits; comply with local advertising standards; avoid clutter and complex imagery that loses impact on moving buses.
Provide designs in scalable formats with proper bleeds and safe margins. Typical bus-wrap art is large-scale; ensure logos and key messages stay within safe zones; specify minimum font sizes for readability at 30-50 km/h; provide vector logos; use high-resolution imagery; color management to match CMYK print; include diel variations for day and night conditions, if required.
Producing a bus wrap involves materials such as high-performance vinyl, laminates, UV-curable inks, and weather-resistant adhesives. Choose wraps when long dwell time and high impact are needed; interior panels or seatback ads for targeted reach. Confirm fleet compatibility, service life, and maintenance plan; coordinate with the operator for installation windows; ensure wrap does not interfere with safety equipment, cameras or signage; plan for possible fleet changes or vehicle rotation.
Production timelines typically run from brief to installation across design, proofs, production, and on-vehicle mounting. Allow 2-4 weeks for creative development and approvals, 1-2 weeks for printing and finishing, and 1-2 weeks for installation, with additional buffer for fleet availability or route changes. Build in preflight checks, color proofs, and contingency time for weather or logistic delays, especially in peak advertising seasons.
Validation includes pre- and post-install checks. Pre-production proofs should be color-calibrated and signed off; ensure diel variants, if used, are approved. After installation, conduct site inspections or publish photos to confirm alignment, coverage, and legibility; verify no safety elements are blocked; track impressions or reach via the media owner’s metrics and campaign reporting. Document any damage or warranty issues and keep an audit trail for future campaigns.
In practice, bus advertising rates in South Africa are driven by fleet size, route reach, and duration, so validation also involves ensuring the proposed creative aligns with the rate card and projected impressions. Work with a reputable operator (for example, JCDecaux SA or oOh!media SA) to secure accurate rate quotes and to receive proofing guidelines and performance data to validate ROI.
By coordinating creative, production, timelines, and validation carefully, advertisers can maximize the impact of bus ads in South Africa within their budget and achieve clear, measurable results.
Regulatory and compliance considerations
Regulatory and compliance considerations for bus advertising rates in South Africa involve navigating road-safety rules, advertising standards, and fair pricing practices. Advertisers must observe the National Road Traffic Act and municipal by-laws for vehicle signage, obtain any required permits, and ensure ads do not distract drivers. They should adhere to the Advertising Standards Authority of SA and the CAP Code for truthful messaging, comply with the Consumer Protection Act on pricing disclosures, and avoid anti-competitive practices under the Competition Act. Local authorities may also affect rate setting through policy on placement, duration, and visibility of bus ads.
Municipal permits and advertising regulations
Regulatory and compliance considerations for bus advertising rates in South Africa shape what you can place on vehicles, who can approve it, and how much it costs.
Nationally, advertising on buses falls under the Advertising Standards Authority (ASA) and the Code of Advertising Practice (CAP). Ads must be truthful, not misleading, and comply with decency and safety guidelines. Complaints can lead to removals or changes, and advertisers should ensure all claims are supportable and compliant with CAP provisions.
Guidance on audience reach and impressions matters for pricing and negotiatons. Any statements about fleet size, route coverage, or viewer numbers should be substantiated with reliable data and aligned with ASA CAP standards to avoid misrepresentation.
Municipal permits and by-laws: Local authorities regulate outdoor advertising, including on public transport and along roadways. Many municipalities require permits or consent for bus advertising, including side panels and banners at depots or along routes. Permit requirements, fees, and approval timelines vary by city and district, so early engagement with the relevant authority is essential.
Vehicle safety and roadworthiness: The National Road Traffic Act and related regulations restrict advertising that obstructs the driver’s view, hides license plates or required lights, or distracts or endangers road users. Advertising materials must not damage the vehicle’s surfaces or compromise structural integrity, and any installation should be reversible without altering essential vehicle components.
Content restrictions and decency: CAP Code prohibits content that is unlawful, discriminatory, or harmful to public morals, and local sign by-laws may add restrictions around school zones, hospitals, or sensitive locations. Advertisements must comply with local content rules and respect community standards as enforced by municipalities.
Data and privacy considerations: If digital screens or interactive features are used, or if data is collected from viewers, compliance with the Protection of Personal Information Act (POPIA) is required. Avoid gathering personal data without proper consent and implement appropriate data-handling safeguards.
Permits and approvals process: Typically, you’ll need consent from the bus operator and a municipal outdoor advertising permit. Some cases require approvals from traffic or transport authorities, and there may be route-specific or time-limited permissions. Expect fees and variable lead times, which can affect campaign start dates and pricing.
Regulatory enforcement and risk: Non-compliance can result in fines, removal of ads, or revocation of permits. Keeping documentation up to date and monitoring for regulatory changes helps mitigate risk and unplanned cost spikes.
Impact on bus advertising rates: Compliance costs—permits, safety checks, sign-offs, and potential renewal fees—are embedded in rate cards. More complex permit processes or stricter municipal controls can raise prices or affect availability, while streamlined approvals or fleet-standardized ads may reduce overall costs.
Practical steps to align with regulations: engage experienced local agencies or legal counsel, coordinate early with bus operators, secure all necessary permits before production, retain copies of approvals, and schedule renewals well in advance to avoid delays.
In summary, understanding the regulatory and permit landscape for bus advertising in South Africa helps secure compliant placements and supports accurate, defensible rate negotiations for campaigns targeting bus audiences.
Road safety and vehicle compliance
Regulatory and compliance considerations, road safety and vehicle compliance in bus advertising in South Africa affect rates and feasibility. Advertisers must navigate national laws, local by-laws, and fleet safety standards to ensure compliant campaigns that also deliver effective reach.
- National regulatory framework and permits
Advertising on buses is guided by the National Road Traffic Act 93 of 1996, associated regulations, and municipal by-laws. Operators may need approvals from traffic authorities and local municipalities before branding or wrapping fleets. Permit fees, inspections, and renewal costs influence upfront advertising budgets and ongoing operating expenses.
- Vehicle safety and advertising formats
Branding materials must not obstruct drivers’ views, mirrors, windows, lights, or safety equipment. Standards cover wrap durability, reflective properties, and placement to ensure readability without compromising safety. Non-compliance can lead to fines, removal of advertising, or vehicle disqualification from routes.
- Road safety impact and driver distraction
Regulations discourage designs that cause glare, distraction, or mislead other road users. Advertisements should use high-contrast, legible typography and concise messaging that does not encourage risky behavior. Adhering to safety guidelines reduces liability and supports smoother operations on busy corridors.
- Asset maintenance and lifecycle compliance
Maintenance requirements mandate that wraps and decals remain intact and legible, without peeling or damage that could obscure signals or safety markings. Lifecycle planning, warranties, and replacement schedules affect campaign continuity and total cost of ownership, thereby influencing rate cards.
- Intellectual property and content approvals
Use of trademarks, logos, and endorsing imagery must comply with IP laws. Contracts should specify content approval processes with fleet operators and municipal authorities, impacting campaign timelines and pricing.
- Impact of compliance on bus advertising rates
Compliance overhead—permits, inspections, maintenance, and audits—adds to the cost base. Advertisers may see these costs reflected in per-bus, per-route, or per-impression rates, or they may opt for bundled solutions that include compliance management.
- Practical steps to streamline compliance
Engage early with road authorities, fleet operators, and municipal offices; maintain comprehensive documentation; schedule inspections; use approved materials; pilot campaigns on select routes to validate regulatory responses before broader rollout.
Copyright and brand guidelines
Regulatory and compliance considerations, copyright and brand guidelines are critical when evaluating bus advertising rates in South Africa. Understanding how rules influence where and how ads appear helps ensure your campaigns run smoothly and avoid costly delays.
Regulatory framework: In South Africa, bus advertising is governed by a mix of self-regulatory codes and statutory rules. The Advertising Standards Authority of South Africa (ASA) administers the CAP Code for non-broadcast advertising and the PACT Code for broadcast ads; both prohibit misleading claims, require substantiation, and set standards on content, targeting, and claims about reach. Advertising on public transport may also require permits or approvals from municipal authorities, transport operators, and sometimes provincial departments, with restrictions on location, size, and duration of displays. Compliance with the Consumer Protection Act (CPA) ensures honesty and transparency in pricing and service promises to customers.
Content restrictions and safety: Ads on buses must not depict illegal activities, discrimination, or hate speech, and content should comply with advertising to vulnerable audiences, where applicable. There are safety requirements to avoid obstructing the driver’s view, windows, or essential safety features; ads must not interfere with vehicle operations or emergency signage. Hard-walling or wraps may require roadworthiness checks and operator consent. Any political advertising is subject to additional rules and timing restrictions.
Copyright and licensing: Use of images, logos, fonts, music, or brand elements requires clear rights. Obtain licenses for stock photography, vector art, and font use; use only brand assets you’re authorized to reproduce. If you feature third-party brands on a bus wrap, ensure you have permission and adhere to trademark guidelines. For any user-generated or crowd-sourced content, secure model releases and location permissions. Remember that South Africa’s Copyright Act protects original works; infringing use can lead to fines or injunctions.
Brand guidelines and visual consistency: When aligning with your brand, maintain approved color palettes, typography, logo treatments, and real estate on bus panels. Ensure legibility from distance and at high speeds; respect safe zones; maintain consistent sizing across ad formats; avoid over-saturation or conflicting marks; ensure that co-branding or sponsorship is permitted and that partner guidelines are followed. Any co-branding or sponsorship must be clearly disclosed to meet ASA standards and CPA expectations.
Impact on rates and practical steps: Advertising rates are influenced by regulatory costs such as permitting, compliance checks, and potential penalties for non-compliance. When evaluating rate cards, request a breakdown that includes permits, design approvals, and any licencing fees. Build in a compliance review step before artwork is finalized, ensuring alignment with CAP/P Act guidelines, CPA statements, and brand guidelines. Document approvals and maintain a record of licenses and releases.
Recommended approach: work with legal and compliance teams early; keep a centralized brand asset library with licensed imagery and approved templates; secure all necessary permits before production; conduct a pre-flight compliance review of all creative; maintain audit trails for approvals and licensing; and set clear terms in your contract about liability for non-compliance or misrepresentation.
Conclusion: Navigating regulatory, copyright, and brand requirements is essential to maximize the effectiveness of bus advertising rates in South Africa. Proactive compliance protects your brand, reduces risk, and supports successful campaigns that resonate with audiences while meeting legal standards.
Campaign planning, scheduling and duration
Effective campaign planning for bus advertising in South Africa starts with defining goals, budgeting, and selecting the right networks to match target audiences. Scheduling hinges on route reach, travel patterns, and peak hours, with durations ranging from short 2–4 week flights to extended 8–12 week runs. Rates vary by city, operator, vehicle type, and renewal frequency, so planners balance flighting, frequency and seasonality to maximize impressions and cost efficiency across South Africa’s bus networks.
Optimal campaign lengths and flighting strategies
Campaign planning for bus advertising in South Africa begins with clear objectives, audience insight, and a budget that reflects the high visibility of buses on key commuter routes across major metros.
Start with your goals: awareness, reach, or a call to action, and map your audience by geography, travel patterns, and peak travel times. In South Africa, major urban centres such as Johannesburg, Cape Town, Durban, and surrounding townships offer dense commuter traffic, making routes along CBD corridors, business districts, and economic hubs particularly valuable. Align route selection with your target demographics, times of day, and event calendars to maximize exposure.
Choose formats and networks that suit your message and budget. Bus advertising can include exterior wraps, full or partial vehicle branding, interior posters, and digital screens where available. Rates are influenced by format, fleet size, route coverage, and the duration of the campaign. In practice, full-wrap or high-visibility exterior placements on large fleets command higher fees, while interior panels and shorter runs on smaller fleets offer lower entry costs. Negotiation with major out-of-home networks and transport operators is common in South Africa, with packages often bundled across multiple formats or routes.
Scheduling and duration play a pivotal role in campaign effectiveness. Consider a mix of continuity and flighting to balance reach with budget. In South Africa’s market, seasonal demand, holidays, and major events (such as paydays, school holidays, or city festivals) can influence traffic patterns and message resonance. Shorter bursts can test message creatives and route performance, while longer runs in strategic corridors consolidate recall and brand presence.
Optimal campaign lengths depend on objectives and format. For awareness and recall in busy metro routes, a 6–12 week run per city block can deliver meaningful frequency without excessive spend. Multi-route campaigns spanning several metros may benefit from staged flights over 12–24 weeks, with periodic creative refreshes to counter fatigue. If a flighting approach is used, maintain a baseline presence on core routes year-round and insert elevated spend during peak periods or promo windows.
Flighting strategies to consider include continuous presence on flagship corridors for steady recognition, and pulsing or seasonal bursts around campaigns or promotions. Continuous exposure supports top-of-mind awareness, while bursts aligned with product launches, retailer promotions, or events can drive short-term response. In South Africa, synchronize flighting with salary cycles, school calendars, and public holidays to capture peak commuting traffic and higher engagement times.
Rates and budgeting hinge on fleet reach, route density, and duration. Rates vary widely by format, operator, and city; full vehicle wraps on large metro fleets are the premium tier, interior formats are more economical, and digital bus screens (where available) command premium for dynamic messaging. When planning, secure a detailed rate card, confirm the exact fleets and routes included, and ask about bundled discounts for longer commitments or cross-format buys. Build flexibility into the budget for creative production, installation, and potential reruns or extensions if results warrant it.
Effective measurement and optimization require clear KPIs and data from media partners. Track impressions or reach estimates based on fleet size and route coverage, monitor message frequency, and compare performance across routes and formats. Use insights to reallocate spend to the highest-performing corridors, refresh creatives to reduce fatigue, and adjust flighting to align with evolving campaigns or external conditions in South Africa’s dynamic urban markets.
Seasonal campaigns and event-driven promotions
Bus advertising in South Africa delivers high visibility in dense urban areas, reaching commuters on a daily basis. For brands, it can be a cost‑effective way to build awareness across major cities such as Johannesburg, Cape Town and Durban, especially when paired with thoughtful campaign planning, strategic route selection and creative designed for quick readability at speed.
Campaign planning: start with clear objectives—awareness, reach, or direct actions—and translate them into measurable targets. Identify the core audience based on route patterns, peak travel times and demographic insights. Map out the routes and locations with the highest dwell time and dispersion to maximize impressions. Choose formats that align with your objective and budget, such as full or partial bus wraps, large panel advertisements or smaller digital screens where available. Consider regulatory requirements, permits and installation timelines, and collaborate with experienced bus owners or media agencies to ensure brand safety and production quality.
Scheduling and duration: decide between continuous exposure or flighting to optimize spend and impact. Shorter bursts (2–4 weeks) can test new creative or audiences, while longer runs (6–12 weeks or more) build sustained recognition. Align campaign start dates with traffic patterns, school holidays and pay periods to capture peak commuter volumes. Account for production and installation lead times, as well as maintenance windows for any wrap or digital panels, to avoid gaps in coverage.
Seasonal campaigns and event-driven promotions: leverage South Africa’s seasonal rhythms—the start of the summer travel period, year‑end shopping frenzy, and school holidays—to boost reach when footfall is highest. Tie campaigns to public holidays, cultural festivals and tourism peaks in each region, such as major city events, sport tournaments or concerts. Seasonal creative should reflect current themes and local relevance, while ensuring readability from a distance and at typical bus speeds.
Event-driven promotions: synchronize with confirmed events on the local calendar to capture heightened attention. Use event-specific messaging, location targeting near venues, and time-bound offers to drive engagement. Consider dynamic or modular creative that can be updated for different events, and coordinate with venue or transport partners to maximize co‑marketing impact and ensure operational readiness around event logistics.
Pricing and rate considerations: bus advertising rates in South Africa are typically structured around the vehicle, format, city, duration and placement, with additional fees for design, production, installation, and permits. Rates are higher in dense markets with larger fleets and urban centers, and wrap campaigns generally command premium prices over panel ads. Because quotes vary by media owner and agency, it is common to receive a package that bundles media buy with creative production or to negotiate discounts for multi-city or multi-week commitments.
Measurement and optimization: set up clear benchmarks for reach, frequency and estimated impressions, and request post‑campaign reports showing route coverage, peak exposure times and creative performance. Use these insights to refine future placements, adjust flighting, and optimize budgets. If possible, pilot a small test in one city before expanding to additional markets to validate KPIs and creative resonance.
Practical steps to plan a bus advertising campaign in South Africa: define objectives and audience, map high-impact routes, choose appropriate formats, secure permits, and build a realistic production timeline. Gather multiple quotes, compare coverage and CPMs where available, and request case studies from the media owners. Develop seasonal or event-driven creative calendars and plan for ongoing measurement to maximize ROI across campaigns.
Negotiation, contracts and procurement
Negotiation, contracts, and procurement underpin how advertisers secure bus advertising rates in South Africa, turning media options into clear, value-driven campaigns. Buyers compare packages, negotiate price, placement and duration, and navigate procurement rules and contract terms that spell out deliverables, performance metrics, and risk allocation. A disciplined process helps agencies and advertisers achieve broad reach on urban routes while ensuring transparent pricing and reliable service levels.
Request for proposals and vendor comparison
Negotiation, contracts and procurement for bus advertising rates in South Africa require clarity on inventory, audience reach, and performance metrics. This article outlines how to run RFPs, compare vendors, and negotiate contracts to maximize value in SA bus advertising.
- Define campaign objectives and target markets in South Africa (for example Johannesburg, Cape Town, Durban) and desired reach.
- Audit available inventory types (full bus wraps, partial wraps, external banners, interior posters, and digital screens) and determine coverage quality by route and depot network.
- Set a budget and select a pricing model (per bus per week, per route, per impression, or per campaign) along with expected flighting and duration.
- Prepare an RFP that covers scope of work, inventory, flighting plan, creative specs, measurement requirements, data rights, and contract terms.
- Issue the RFP to a short list of vetted vendors and request proposals by a clear deadline.
- Evaluate proposals using a transparent scorecard focusing on reach, price, production and installation capabilities, service levels, and references.
- Negotiate terms, finalize the contract, and plan for campaign launch and ongoing optimization.
RFP content and evaluation criteria
- Executive summary of proposed solution and intended reach in SA.
- Inventory details: routes, depots, buses, wrap vs poster inventory, and schedule.
- Pricing structure: total cost, CPM or cost per bus-week, discounts for multi-city or longer terms, production and installation fees.
- Measurement and reporting: expected impressions, data sources, verification method, and cadence of reports.
- Contract terms: term length, renewal options, termination rights, exclusivity, and price escalation.
- Delivery and service: installation timelines, maintenance, replacements for damaged assets, on-ground support.
- Compliance and risk: adherence to ASA guidelines, POPIA/POPIA requirements, and local advertising regulations.
Pricing considerations and rate factors in SA
- Rates vary by city, network, and inventory quality; major markets generally command higher prices.
- Common pricing models include per bus-per-week, per route, per impression, and inclusive of production/installation where applicable.
- Discounts may be offered for multi-city campaigns, longer commitments, or bundled media assets (wrap plus interior posters).
- Production, installation, and maintenance costs are typically separate but can be bundled in some proposals.
- Contractual terms such as early termination, renewal escalators, and performance-based rebates should be negotiated.
Vendor comparison tips
- Ask for case studies and verifiable references from similar campaigns in SA markets.
- Require proof of performance, post-campaign reporting, and route-level impression estimates.
- Assess the reliability of installation crews and the speed of asset replacement if damage occurs.
- Evaluate the media owner’s compliance with ASA guidelines and POPIA/POPIA requirements.
- Consider added value services such as creative development, digital enhancement, or cross-channel integration with digital out-of-home.
Contract terms, SLAs and renewal options
Negotiation, contracts and procurement for bus advertising rates in South Africa hinge on balancing cost with reach, reliability and compliance. Buyers should approach discussions with a clear understanding of target routes, preferred bus fleets and the campaign duration to establish a realistic budget and timeline.
Rate structures in South Africa commonly vary by city, route popularity, vehicle type and time of day. Vendors may offer base rates, volume discounts for longer commitments, multi-route bundles, and safeties for LED or wrap campaigns. Understanding these models helps negotiators compare apples to apples and identify meaningful savings without compromising exposure.
Effective negotiation relies on data-driven leverage. Gather current market quotes, historical campaign performance, and competitor offers. Consider bundling across multiple municipalities such as Johannesburg, Cape Town and Durban, or pairing bus ads with complementary channels like transit shelters or radio to strengthen your position. Prepare alternative packages and optional add-ons to create room for concessions.
Contract terms should specify duration, renewal mechanics, price adjustment methods and geographic scope. Include clear inventory commitments, delivery timelines, creative approval processes, and any restrictions on ad content. Define who bears responsibility for production, installation and maintenance of vehicle advertising, plus scheduling windows to avoid service interruptions.
Service level agreements (SLAs) translate expectations into measurable outcomes. Typical SLAs cover campaign delivery dates, ad fit and finish standards, uptime for digital displays, and guarantees on impression or reach metrics. Include reporting cadence, data accuracy, and remedies for under-delivery, such as accelerated rotations or compensation credits. State responsibility for maintenance, weather-related damage, and fast remediation timelines for any faults.
Renewal options should be explicit and fair. Consider automatic renewal with a predefined notice period, but include a cap on annual price escalations and a mechanism for renegotiation based on performance or market changes. Allow exits for non-performance, or include a step-down option if target impressions drop. Document renewal pricing, compatibility with new formats, and any required re-approval of creative assets.
Procurement processes may involve formal RFPs or RFQs, especially for larger campaigns or public sector partners. Define evaluation criteria such as cost per impression, reach potential, safety and compliance, vendor stability, and sustainability considerations. Include procurement rules for tendering, confidentiality, and how disputes will be resolved to minimize delays.
Compliance and risk management are essential in South Africa. Ensure contracts align with advertising regulations, municipal by-laws, and industry codes, including content restrictions and privacy considerations for any digital components. Address liability, indemnities, insurance, and indemnification limits, as well as termination rights for breach or non-compliance.
Practical negotiation checklist: define objectives and budget, map routes and timings, request multiple quotes, compare total cost of ownership, specify SLAs and reporting, lock in renewal terms with price protections, and confirm compliance requirements. A well-structured contract in bus advertising rates South Africa should balance cost efficiency with guaranteed visibility and accountable service throughout the campaign lifecycle.
Cost breakdown and ROI considerations
Cost breakdown is the starting point for assessing bus advertising rates in South Africa and estimating ROI. Key components include production and design costs, bus space rental (front, sides, or interior panels), installation, duration of the campaign, and any agency or management fees, plus potential discounts for multi-bus or longer terms. To measure ROI, forecast reach and impressions, calculate CPM, and track conversions or inquiries through trackable calls or online traffic linked to the campaign. The most cost-effective campaigns optimize route selection for high-traffic corridors, balance frequency with reach, and align creative with measurable call-to-action while allowing for post-campaign analysis.
Approximate costs by format
Cost breakdown and ROI considerations for bus advertising in South Africa depend on format, route exposure, city dynamics, and campaign length. Understanding the main cost components helps you compare formats and forecast ROI more accurately.
Key cost components typically include creative design, production and installation of the ad (wraps, banners, or interior signage), ongoing media space costs (per vehicle per month), and agency or program management fees. Prices are usually quoted per vehicle per month and vary by city, operator, route popularity, and campaign duration. Longer campaigns and larger fleets often yield better rates, while high-traffic urban markets tend to be priced higher.
Approximate costs by format (per vehicle per month, with one-time design/production where relevant): Full exterior wrap: 60,000–180,000 ZAR; Partial wrap or exterior side panels: 25,000–70,000 ZAR; Exterior rear panel only: 12,000–40,000 ZAR; Interior posters, seat cards, or panels: 2,000–6,000 ZAR; On-board digital screens (if available): 20,000–60,000 ZAR. One-time design and production: full wrap 60,000–150,000 ZAR; interior signage 5,000–20,000 ZAR. Discounts are common for multi-bus fleets and longer durations, and prices can vary by market (Johannesburg, Cape Town, Durban, etc.).
ROI considerations start with a clear objective (brand awareness, store visits, app sign‑ups, etc.) and a method for measuring impressions and actions. Estimate reach by multiplying riders per bus per day by the number of buses and campaign days, then compute impressions and CPM (cost per thousand impressions). Compare the calculated CPM with benchmarks for outdoor media and digital channels in your target market, and consider non‑quantified benefits like brand recall and local market penetration. Trackable touchpoints (QR codes, vanity URLs, or unique landing pages) help link exposure to measurable actions and revenue.
Example calculation (illustrative only): A 3‑bus fleet runs a full exterior wrap for 3 months. Suppose the mid‑range monthly cost per bus is 100,000 ZAR, giving a total spend of 900,000 ZAR. If the three buses in busy routes reach roughly 20,000 riders per day each, total monthly impressions are about 60,000; over 3 months this is roughly 5.4 million impressions. CPM = 900,000 ZAR / (5,400,000 / 1,000) ≈ 167 ZAR per 1,000 impressions. If 0.5% of impressions convert to visits via a trackable offer (5,400 visits) with an average sale value of 350 ZAR, potential revenue from conversions could be around 1,890,000 ZAR. Subtract the 900,000 ZAR cost and you get an illustrative net of about 990,000 ZAR, implying a strong ROI in this simplified scenario. Real ROI will depend on route choice, creative effectiveness, and the quality of conversions tracked.
Tips to improve ROI include selecting high‑footfall corridors and peak travel times, coordinating with digital channels for cross‑channel prompts, running pilots with smaller fleets before scaling, using strong creative that communicates a single, clear call to action, and employing robust tracking to quantify lift. Also factor in seasonality, the target audience, and the potential for incremental brand lift even when direct conversions are not immediately measurable.
Measuring reach, recall and impact
Bus advertising rates in South Africa vary widely, but a solid understanding of cost breakdown and ROI helps ensure campaigns are cost-effective. This article covers how costs are structured and how to measure reach, recall and impact for bus advertising campaigns across major SA cities.
Cost breakdown for a typical SA bus advertising campaign includes production and creative development, physical media production (wraps, decals, or interior panels), installation and removal, media rental (the space on the fleet), duration and frequency, route exposure premiums, digital options if available, agency or brokerage fees, permits and approvals, and ongoing maintenance.
Rate determinants in South Africa include city and operator, size of the fleet used, whether it is a wrap (full exterior), partial wrap, or interior panels, duration of the campaign and how many times per day the same route runs, the popularity of routes (CBDs, business districts, high-traffic corridors), and whether additional services like geofenced digital extensions are included. Prices tend to be higher in major metros and premium corridors, and lower on smaller routes or with smaller fleets.
As you negotiate, consider hidden costs: design approvals, installation and removal from night shifts if required, transport and storage of materials, potential repainting, and contingency allowances; discounts for longer commitments or multiple buses; check if the quote includes VAT and any applicable levies or permits. Clarify inclusions vs. add-ons to avoid surprise charges during the campaign.
ROI considerations: Bus ads excel at building reach and brand recall rather than driving immediate direct-response sales. Set clear objectives—awareness lift, reach, message frequency. Consider synergy with other channels (radio, digital, social, in-store activity). Plan a measurement framework that ties media exposure to outcomes such as website traffic, search interest, store visits, or coupon redemptions, and account for baseline brand metrics.
Measuring reach: Estimate impressions by combining fleet size, average passengers per bus per day, route coverage, and campaign duration. If the operator provides daily audience estimates, use those; otherwise build a model: impressions = number of buses × routes × passengers per bus × days in service × coverage factor. Use city and route data to adjust for peak vs. off-peak times, and consult operators for any available traffic or audience metrics to refine the estimate.
Measuring recall and impact: Use pre- and post-campaign surveys to measure unaided and aided recall, including exposure questions. Leverage trackable elements such as QR codes, unique landing pages, or promo codes to quantify response. Monitor changes in brand search volume, social mentions, and website visits, and consider a light post-campaign lift study to isolate the contribution of bus advertising within the broader marketing mix.
ROI calculation: ROI = (incremental profit from campaign − campaign cost) / campaign cost × 100. A simple illustrative example: if campaign cost is R1,000,000 and the measured incremental revenue associated with the campaign is R1,800,000, the ROI would be (1,800,000 − 1,000,000) / 1,000,000 × 100 = 80%. Use incremental profit rather than gross revenue when possible, and factor in any additional lifecycle or downstream effects the campaign may influence.
Practical steps to plan: define your objective and target routes, gather quotes from multiple operators, and request a detailed measurement plan up front. Start with a small, scalable test on a subset of buses or routes, then expand if results meet your KPIs. Align bus media with other channels to maximize impact, and document success metrics, data sources, and the attribution approach before launching.
Bus advertising rates in South Africa are influenced by city, fleet size, and format, but a rigorous cost breakdown and a careful measurement plan can make these campaigns a compelling part of a broader brand-building strategy.
ROI frameworks for OOH in SA
Bus advertising in South Africa offers mass reach in large urban centers, but the value hinges on a clear view of costs and how ROI will be measured across SA’s unique markets.
Cost breakdown in SA bus campaigns typically includes media costs, production and creative, installation and maintenance, permits and licensing, and agency or operator commissions. Media costs cover the rate card for the chosen fleet or routes and depend on factors such as wrap type (full wrap, partial wrap, or panel ads), location (prime routes and city centers command premiums), duration (daily, weekly, or monthly), and fleet size. Production and creative costs cover design, print, and wrap materials, with higher-quality finishes and longer-lasting vinyl driving up the price. Installation and ongoing maintenance include wrap installation, repairs, replacements for damaged panels, and cleaning. Permits, regulatory compliance, and any transit operator fees add to the upfront and ongoing costs. If you work with an agency, commissions or service fees may also appear in the budget.
Media cost models in South Africa vary by operator and city. Rates are typically higher for prime corridors in major metros such as Johannesburg, Cape Town, and Durban, with regional differences between urban buses, intercity fleets, and airport routes. Costs can be quoted per bus per day, per bus per week, or per campaign for a fleet, and may differ for full wraps versus partial wraps or static panel ads. Seasonal demand and availability of high-visibility routes can pressure pricing, so negotiating volume buys or bundling with other OOH assets can improve overall value.
Production and creative costs depend on the scope of the artwork, the complexity of the wrap, and the quality of materials. A full wrap with high-end UV-resistant vinyl will carry a premium over partial wraps or panel ads. Short lead times can increase design and fabrication costs. You’ll also want to plan for revisions, color proofs, and kit variations to ensure consistency across the fleet and across different fleet configurations.
Installation, maintenance, and lifecycle costs include the initial wrap application, ongoing surveillance for wear and tear, touch-ups, and eventual replacement or removal at the end of the campaign. Wraps typically last several months but may require maintenance in high-traffic areas or harsh weather, adding to total cost if frequent repairs are needed. Permits and licensing fees, as well as any required approvals from bus operators or municipal authorities, should be anticipated as ongoing or one-time costs. If a media owner uses an agency, expect potential service fees or commissions to be included in the overall cost structure.
Estimating reach and impressions for SA bus campaigns relies on fleet size, route coverage, and traffic dynamics. A practical approach is to estimate impressions as: number of buses on the campaign multiplied by an average daily exposure per bus, multiplied by the campaign duration, adjusted for route popularity and dwell time. For example, with six buses deployed for 28 days and an illustrative daily exposure of 12,000 impressions per bus, total impressions would be about 2.0 million. This IMI (impressions) figure can be used to calculate CPM: campaign cost divided by (impressions/1,000). While these figures are illustrative, they help set expectations and guide optimization when combined with real traffic counts and route data from the operator.
ROI frameworks for OOH in SA include several practical approaches. A simple cost-based ROI measures the net profit impact: ROI = (incremental revenue from the campaign minus total campaign cost) divided by total campaign cost. A ROAS (return on ad spend) framework uses revenue generated from the campaign divided by the campaign cost, expressed as a multiple. A CPM-based efficiency metric compares cost to impressions: CPM equals campaign cost divided by (impressions/1,000). Break-even analysis is useful: determine the minimum incremental revenue needed to cover all campaign costs, guiding whether a proposed spend is viable given expected lift. Multi-touch attribution is valuable when the OOH activity runs alongside digital, radio, and print; you can model the incremental lift attributed to bus media by using control groups, holdout periods, or time-series analysis to separate effects. In SA, where consumer behavior and media consumption patterns vary by city, combining holdout tests with local sales data and brand lift surveys can provide sharper ROI signals.
Measurement and attribution require careful planning. Use pre- and post-campaign baselines, track sales or footfall tied to call-to-action codes or UTMs where appropriate, and align with regional data like city traffic counts and route-level exposure. Consider tests that compare regions or routes with and without exposure to isolate impact. When possible, integrate bus OOH data with other channels (digital, radio) to build a cohesive attribution model and avoid over-attributing lift to a single touchpoint.
Practical planning tips to maximize ROI in SA include targeting high-traffic corridors and dense urban areas, coordinating with complementary media (digital outdoor, radio, or retail promotions), and ensuring creative clarity for quick viewer comprehension. Plan for flexible assets that allow adjustments during the campaign and build in contingency costs for maintenance or replacements. Leverage longer-term commitments where possible to secure better per-unit rates, and ask for route-level performance data from operators to refine targeting mid-campaign.
Illustrative ROI example: suppose a campaign spends 240,000 ZAR (media costs plus production and installation) to run six buses on prime routes for four weeks. If the campaign generates an incremental 480,000 ZAR in revenue through direct or attributable lift, the ROI would be (480,000 – 240,000) / 240,000 = 1.0, or 100%. The ROAS would be 480,000 / 240,000 = 2.0. Impressions in this scenario might total around 2 million, yielding a CPM of about 120 ZAR per thousand impressions. Note that these figures are for illustrative purposes and should be tailored to actual fleet data, route traffic, and market rates to produce a reliable ROI.
In summary, bus advertising rates in South Africa are highly variable, influenced by fleet size, wrap type, route premium, city, and campaign duration. A robust cost breakdown paired with clear ROI frameworks—covering incremental revenue, ROAS, CPM efficiency, and attribution—helps planners evaluate value, optimize spend, and make data-driven decisions that reflect SA’s diverse urban markets.
Benchmarks, case studies and performance insights
Benchmarking bus advertising rates in South Africa requires a look at cost benchmarks, real-world case studies, and performance insights that connect spend to audience reach and engagement. This introductory overview frames typical rate ranges by route and format, highlights successful campaigns in major cities, and explains how benchmarks and case data inform buying decisions, flighting, and creative strategy for maximum ROI in the South African transit environment.
Representative SA campaigns and outcomes
Bus advertising in South Africa remains a cost-effective way to reach large urban audiences, with rates that vary by city, route, format and contract length. In SA, campaigns span exterior bus panels, interior ads, bus shelters, and digital screens on select fleets, each with its own price tier and performance profile.
Benchmarks indicate that rate cards are commonly structured per impression, per week per bus, or per campaign package. Exterior panels on high-traffic routes carry a premium, interior cabin panels offer lower reach but captive attention, and digital on-bus screens command the highest premiums. A typical SA bus campaign can range from a modest weekly spend on secondary routes to larger investments on flagship corridors, with pricing influenced by flight length, fleet size and city.
Key rate determinants include city size and traffic density, the sophistication of the fleet operator, whether the ad is on a national or regional route, and the duration of the flight. Longer commitments, bundled packages across multiple routes, and seasonal drives (back-to-school, festive seasons) can unlock discounts, while last-minute placements usually carry a rush fee or premium.
Performance insights suggest designs should be legible at quick glance, using high-contrast text, very limited copy, and a clear call to action. Creative should align with the commuter context—bright branding, minimal messaging, and consistent typography across formats. Complementing offline bus placements with digital tracking codes, customized landing pages, or promo codes improves measurability and attribution.
Case study: a national retailer deployed bus exterior ads on major metropolitan corridors in Johannesburg, Cape Town and Durban during the festive shopping period. The campaign leveraged consistent branding across routes and tied in-store offers to a landing page with a unique promo code. Outcomes included broadened reach across key metro areas and measurable uplifts in foot traffic and online interest for promoted products.
Case study: a financial services brand ran an interior bus campaign across mid- and high-traffic inner-city routes to promote a new mobile banking feature. By pairing the ads with trackable URLs and in-app onboarding prompts, the campaign captured incremental app sign-ups and higher brand consideration during the flight window, compared with baseline periods.
Case study: a public health agency used bus shelter posters and interior panels to raise awareness about vaccination campaigns in urban districts. Pre- and post-campaign surveys indicated increased recall and message salience among commuters, with qualitative feedback suggesting better understanding of when and where to access services.
Representative campaigns and outcomes across SA show that bus advertising delivers broad urban reach and strong visibility on key commuting routes. The most successful efforts combine consistent creative, precise targeting on high-traffic corridors, and strong measurement through unique URLs, QR codes or redemption offers. When used alongside other OOH formats and digital channels, bus advertising can contribute to stronger campaign salience and action rates.
Best practices for SA bus campaigns include planning with a multi-route flight to maximize reach, testing creative variants for readability at standstill or in motion, coordinating with operator schedules for peak hours, and ensuring compliance with local advertising regulations. An explicit measurement plan with baseline metrics, post-campaign lift and attribution windows helps translate impressions into business outcomes.
In summary, bus advertising in South Africa offers scalable reach with flexible pricing that can suit various budgets. By understanding rate drivers, optimizing creative for quick comprehension, and tying placements to trackable responses, brands can achieve meaningful exposure in busy urban environments.
Benchmark figures by city and format
This article presents benchmarks, case studies and performance insights for bus advertising rates in South Africa, focusing on benchmark figures by city and format to help brands plan campaigns with clarity on cost and expected reach.
Johannesburg benchmark figures: exterior full wrap typically ranges from R180,000 to R320,000 per month, exterior partial wraps often cost between R60,000 and R120,000, interior banners run about R20,000 to R45,000, and interior digital screens (where available) range from R25,000 to R70,000 per month. Contracts of 3 to 6 months generally unlock discounts of 10% to 25% depending on fleet size and duration.
Cape Town benchmark figures: exterior full wraps usually cost R160,000 to R290,000 per month, exterior partial wraps around R50,000 to R110,000, interior banners roughly R18,000 to R40,000, and interior digital screens about R20,000 to R60,000. Longer commitments yield similar discount bands, with larger fleets commanding higher absolute savings.
Durban benchmark figures: exterior full wraps typically fall in the R140,000 to R260,000 per month range, exterior partial wraps from R50,000 to R100,000, interior banners from R15,000 to R35,000, and interior digital screens from R22,000 to R55,000. As with other markets, multi-month contracts improve overall pricing efficiency.
Pretoria benchmark figures: exterior full wraps usually cost between R150,000 and R280,000 per month, exterior partial wraps from R55,000 to R105,000, interior banners from R18,000 to R38,000, and interior digital screens from R22,000 to R60,000.
Case study 1 — Johannesburg: A consumer electronics brand ran an exterior full-wrap campaign for six weeks on high-visibility routes. The campaign delivered an estimated 2.3 to 2.6 million monthly impressions with a lift in unaided brand recall of around 14% and ad recall improving by about 9%. The initiative supported a 12% increase in online searches and a 7% rise in store visits attributed to the campaign during the period.
Case study 2 — Cape Town: A tourism board deployed interior banners across a subset of buses during peak travel season, complemented by a digital interior screen in select fleets. Over 10 weeks, partner attractions saw a 18% uptick in footfall and a 28% increase in targeted website traffic, with promo-code conversions yielding a modest but measurable uplift in bookings and a clear cross-channel lift when paired with social media activity.
Case study 3 — Durban: A retail chain used an exterior partial wrap on a guard of routes serving dense catchment areas. Over eight weeks, in-store visits rose by approximately 14% and average basket size during promo weeks rose by around 6%. The campaign demonstrated efficient in-market reach with a favorable cost per in-store visit compared to some digital channels at similar budgets.
Performance insights and best practices: To maximize return, tailor format choice to route visibility and route density in each city, test a mix of exterior wraps for broad reach and interior banners for persistent recall in high dwell-time conditions, and consider limited digital interior screens where available to optimize message refresh and CTA responsiveness. Longer contracts improve CPM efficiency, but creative should be refreshed mid-campaign to prevent fatigue. Align bus campaigns with cross-channel activity (radio, social, in-store promotions) to amplify frequency and attribution, and use clear, locally resonant messaging and offers to drive measurable store visits or promo redemptions.
Comparisons with other out-of-home media in South Africa
In South Africa, bus advertising sits in the broader landscape of out-of-home media alongside billboards, transit shelters and digital screens, offering mobile, city-wide reach at a distinct price point. Rates for bus campaigns are typically influenced by vehicle type, route exposure, duration and market, often delivering strong urban visibility and targeted impressions, though comparisons with other formats must weigh factors such as dwell time, audience segmentation, and overall reach to determine the most cost-effective choice for a given campaign.
Bus advertising vs billboards
Comparing out-of-home media in South Africa shows that bus advertising and billboards each offer distinct strengths for brands aiming to reach urban audiences. In this article we focus on bus advertising rates in South Africa and how bus ads stack up against traditional billboards and other outdoor formats.
Bus advertising in South Africa encompasses wraps that cover a bus exterior, door panels, interior panels, and sometimes adjacent shelter displays. This format creates high-impact, moving creative that can dominate a street scene. Rates are typically structured around the bus or route and can be sold on weekly or monthly terms. Campaigns often deliver strong brand recall due to large, immersive visuals and the ability to reach dense, transit-oriented crowds during peak hours.
Billboards remain a cornerstone of out-of-home media with broad visibility and a sense of permanence. Static billboards offer long exposure in high-traffic corridors, while digital billboards enable dynamic messaging that can rotate by time of day or day of the week. In South Africa, billboard costs tend to be highest in premium urban locations and peak periods, reflecting the scale of reach and the premium on sightlines along major corridors.
When it comes to reach and targeting, bus advertising excels at frequency in specific neighborhoods and along fixed routes. This makes it especially effective for local campaigns, promotions near transit hubs, or mass-market brands seeking repeated exposure in a defined area. Billboards, by contrast, provide broad citywide or regional coverage and are well suited for creating top-of-mind awareness with a wider audience that spans multiple neighborhoods.
Creative considerations also differ. Bus wraps and interior panels demand bold, concise messaging that can be absorbed in a few seconds or while passengers move through the vehicle. The wrap’s scale creates a memorable impression, but color and contrast must be carefully designed to remain legible from a distance and in motion. Billboards allow longer copy and larger visuals, particularly digital formats that can feature rotating messages, but limited proximity interaction compared with the immersive effect of a wrapped bus.
Costs and the idea of bus advertising rates in South Africa are influenced by city size, operator pricing, route demand, and inventory. Bus campaigns can be cost-effective on a per-impression basis when you measure impact against high-frequency exposure in targeted areas. However, a wrapped bus along a prime route may carry a higher upfront price than a standard billboard, even though it delivers a powerful, localized presence. Interior bus ads and shelter ads provide more budget-friendly options with solid reach, particularly in bus-heavy corridors.
Comparisons with other OOH media in South Africa also show that taxi rank advertising, airport signage, and digital street furniture can fill gaps in reach, cadence, and audience. Taxi ranks offer high dwell times and strong urban reach for certain demographic slices, while airport displays can capture national or business-focused audiences, albeit typically at higher price points. Digital street furniture and other transit-linked formats can provide dynamic, data-driven messaging that remains responsive to context and time of day.
Choosing between bus advertising and billboards (or other OOH formats) depends on campaign goals, budget, and the desired balance between reach and frequency. If local, high-frequency exposure in specific neighborhoods is the objective, bus advertising may deliver more impressions per rand and a stronger local signal. If the aim is broad, citywide awareness, billboards—especially digital ones—can be more effective. A mixed approach that leverages the strengths of both formats often yields the best return on investment in South Africa’s vibrant urban markets.
Bus advertising vs digital OOH
Bus advertising remains a staple of South Africa’s out-of-home media mix, offering wide reach along metropolitan and peri-urban routes during peak commuting hours. When brands assess value, they often compare bus ads with digital OOH to understand trade-offs in reach, flexibility, and cost—and to decide how to allocate budget across channels.
Beyond buses, South Africa’s OOH landscape includes static billboards, street furniture, taxi advertising, rail transit, and digital screens. Each channel has distinct characteristics: billboards and street furniture deliver high visibility at fixed locations; taxi and transit panels provide on-the-go exposure; digital out-of-home adds dynamic creative and real-time optimizations. The choice depends on target audience, geography, and campaign objectives.
Bus advertising rates in South Africa vary by city, operator, vehicle type, and the specific bus placement (exterior wraps, side panels, or interior posters). Campaigns longer than a few weeks typically secure better per-day rates, and full-bus wraps command higher fees than single-panel interiors. Production costs for artwork and installation are usually separate from the media buy and can influence overall project cost.
Digital OOH in South Africa is usually priced on a cost-per-impression basis or per second of airtime across a network of digital billboards and screens. Rates reflect audience size, location, screen resolution, and the ability to schedule creative in real time. While DOOH campaigns can incur higher upfront costs than static bus ads, they offer measurable reach, flexible creative, and the ability to execute region-specific or time-of-day messaging.
In terms of comparison, bus advertising excels for mass, context-rich exposure along major commuting corridors and in city centers. It tends to be cost-effective for broad brand awareness but offers more limited measurement than DOOH. DOOH benefits from precise targeting, dynamic content, and robust analytics, including impression counts and cross-screen attribution, which can justify higher CPMs for digitally driven campaigns.
For brands evaluating a campaign, a blended approach often yields the best value: use bus ads to build broad awareness and geographical reach while deploying DOOH for targeted timing, location-specific messages, and performance tracking. Important planning elements include route selection based on the audience, campaign duration, creative adaptation to different formats, and a measurement plan that aligns with objectives.
Ultimately, understanding bus advertising rates in South Africa requires talking to operators and media buyers about current pricing structures, inclusions, and any surcharges. When paired with a clear objective and a well-designed DOOH component, bus advertising can deliver complementary reach within a cost-efficient OOH strategy.
Cost-effectiveness and audience quality
Bus advertising in South Africa offers a compelling mix of reach and frequency for brands targeting urban audiences. In major cities, commuter fleets travel through high-traffic corridors daily, providing a ready-made platform for visibility through exterior wraps, partial wraps, interior panels, and backlit displays.
Compared with other out-of-home media in South Africa, bus advertising tends to blend broad geographic reach with strong on-route presence. Billboards (static or digital) often deliver higher-impact visuals but are location-based and can be pricier per impression in core markets. Digital billboards and other digital OOH offer dynamic creative and precise scheduling but require higher upfront spend and may miss moving audiences outside digital coverage. Bus campaigns, particularly multi-vehicle or route-wide buys, can deliver frequent, repetitive exposure to commuters as they traverse multiple neighbourhoods, often at a lower cost per impression when scaled, though single-route efforts may be less efficient than a well-placed billboard. Transit media providers also offer interior and exterior formats or wraps that extend visibility into riding time, increasing engagement compared with roadside posters alone.
On cost-effectiveness, bus advertising sits between billboards and digital OOH in many SA markets. Rates depend on city, operator, format (full wrap, partial wrap, interior cards, or window decals), duration, and the number of buses included. Exterior wraps and full bus campaigns deliver high reach and recall for long-running programs, while interior panels can be a more economical option for targeting specific routes or timelines. When campaigns span multiple buses and corridors, the cost per thousand impressions can compare favourably with other OOH, particularly for mass-market reach in metropolitan areas. Bundling bus with other OOH inventory or with digital extensions can improve efficiency and enable frequency control.
Audience quality for bus advertising in SA is strong for daily urban commuters, shoppers along transit corridors, and workers in central business districts. The audience is broad by age and income, but exposure tends to be more geographic and route-specific than demographic targeting. For brands seeking mass awareness or route-based promotions (events, product launches, limited-time offers), bus media provides reliable reach. The inability to granularly target micro audiences is a caveat, so campaigns often perform best when paired with digital or other OOH with better targeting options.
For advertisers evaluating bus advertising rates in South Africa, request rate cards from multiple operators and compare formats (wraps vs interior vs exterior), route coverage, and campaign duration. Seek package deals that include multiple vehicles or routes, and explore discounts for longer commitments. Align creative with clear calls-to-action, and consider integrating with digital components (QR codes, trackable URLs, or social campaigns) to measure engagement. Before committing, run a pilot on a handful of routes to gauge reach and frequency, then scale based on observed impressions and qualitative feedback.
Practical tips for brands considering bus advertising in SA
Practical tips for brands considering bus advertising in South Africa begin with understanding current bus advertising rates, then pairing high-traffic routes and targeted time slots with flexible packages, negotiating bundled placements, and tracking reach and frequency to maximize ROI on your campaign.
Checklist before contracting
Bus advertising rates in South Africa vary widely depending on city, network, format, and campaign length. To make the most of your budget, start with clarity on what you want to achieve and how many impressions you need.
Practical tip: define your objective and target audience. Are you building broad awareness or driving foot traffic to a store or event? Which neighborhoods, city corridors, or routes are most likely to reach that audience? Align your choice of routes and timing with your goals.
Choose the right format for your message and budget. Full or partial bus wraps, exterior decals, and interior panels each deliver different visibility, durability, and price. Exterior wraps offer high impact but can be costly; interior panels may be cheaper but with less reach. Consider a mix if appropriate.
Map routes and coverage before contracting. Ask providers for route maps, reach estimates, and impression projections. Where possible, request case studies from brands in similar sectors and verify the math behind estimated reach and frequency.
Understand rate structures and what’s included. Rates can be quoted as flat fees, CPM or impression-based, and may include setup, artwork, installation, and removal. Clarify what is included and what incurs extra charges, such as production, permits, and contingency for repairs.
Plan production and creative carefully. Know your technical specs (dimensions, file formats, color and safety guidelines) and allow ample lead time for proofs, sign-offs, and any plant validation. Make sure the design works on moving vehicles and meets driver safety rules.
Consider regulatory and safety compliance. Check local advertising codes, bus company policies, and municipal permits. Ensure the campaign respects road safety rules and does not disrupt operation or passenger safety.
Set up measurement and reporting. Agree on KPIs (impressions, reach, average frequency, or store visits), reporting cadence, and the method for attribution. Use trackable elements like unique URLs or QR codes to measure engagement.
Budget wisely and test before scaling. If possible, pilot on a limited set of routes or a shorter flight to validate impact before committing to a larger rollout. Compare with other channels to optimize return on investment.
Vendor due diligence. Check the provider’s network reach, fleet quality, maintenance standards, and client references. Ask for a media kit with format options, pricing, and case studies.
Checklist before contracting
1) Define objectives and target audience.
2) Obtain a media kit and format options from providers.
3) Request complete rate cards and confirm what is included (production, installation, removal, VAT).
4) Ask for route-level reach and impression estimates, plus supporting case studies.
5) Confirm geographic coverage, fleet details, and alignment with target routes.
6) Clarify campaign length, flighting, and available discounts for longer commitments.
7) Verify creative specs, production timelines, and proofing processes.
8) Review contract terms: cancellation, renewal, exclusivity, territory, and renewal pricing.
9) Check regulatory and safety compliance, permits, and local advertising rules.
10) Establish measurement and reporting methods, success metrics, and data ownership.
11) Assess maintenance, asset replacement policies, and liability for weather-related damage.
12) Confirm internal approvals, budgeting, and payment schedules before signing.
Best practices to maximize impact
Bus advertising in South Africa can deliver broad local reach in key urban areas. To maximize impact, brands should plan format choices, route strategy, timing and compelling creative that fits the moving canvas of a bus fleet.
Practical tips: start with clear objectives and measurable goals, such as awareness lift or foot traffic, then define the target audience by city, neighborhood and commute patterns. Align bus media with your overall mix and set benchmarks for impressions, reach and frequency.
Formats and rates vary by city and by format. Typical options include exterior bus wraps or half-wraps, side-panel adverts, window graphics and interior boards. Costs depend on the fleet size, duration, route density and the level of wrap; major metros usually demand higher rates than secondary markets. Expect a wide price range, and insist on a detailed quote that includes production, installation, maintenance and rotation schedules.
Route planning matters more than you might think. Choose routes with high daily footfall and long dwell times near workplaces, shopping hubs and transport nodes. Schedule in peak commuting windows and align with events or promotions to boost recall. If possible, test one route first before scaling to multiple cities.
Creative design should prioritize legibility and impact. Use bold, high-contrast colors and large type; keep copy to a single, clear message and a strong call to action. Place branding at the top or early in the layout and ensure the sole focal point is easy to read from a distance. Include a short URL or QR code to capture response and measure engagement.
Compliance and safety are essential. Check local advertising codes, obtain necessary permits, and coordinate with fleet operators to avoid blocking windows or driver lines of sight. Use weather-resistant materials and confirm that creative placement respects safety guidelines for windows and wraps.
Measurement and attribution can be challenging but are essential. Obtain impression estimates and route data from the media owner, supplement with independent studies or mobile analytics where available, and track responses via QR codes or trackable URLs. Run a short pilot to establish baseline metrics before expanding the buy.
Budgeting and negotiation tips: begin with a pilot in one city to validate impact, then consider a multi-city plan for better value. Negotiate for longer flight dates to secure discounts, bundled production, and guaranteed rotation. Make sure the contract clearly defines delivery dates, creative specs, and replacement timelines in case of damage or weather issues.
Best practices to maximize impact include integrating with your digital campaigns—use the same creative with concise, consistent messaging across channels and link the bus media to your online trackers. Use multiple formats (wraps, side panels, interior boards) to reinforce the message, and time the rollout to synchronize with other media buys for maximum reach and frequency.
Seasonality and maintenance are worth planning for. Adapt creatives for holidays or annual events, and ensure materials withstand sun exposure and weather so messages stay legible. Regularly inspect panels for peeling or damage and budget for replacement or refresh during the campaign period.
With careful planning, targeted routes, crisp creative and solid measurement, bus advertising in South Africa can be an effective way to reach engaged commuters across major metros while delivering a scalable path to measurable brand impact.
Future trends and market outlook
South Africa’s bus advertising market is moving toward greater price transparency and flexibility, with rates trending upward in premium city corridors yet stabilizing as digital inventory expands. Growth is driven by digital screens, route-level targeting, and programmatic buying, enabling advertisers to tailor spend to peak commuter times on routes in Johannesburg, Cape Town, and Durban. While regulatory and safety considerations, inflation, and competition from other DOOH formats can temper increases, the overall outlook remains constructive for brands seeking measurable reach among urban commuters.
Technology integration and data-driven targeting
Bus advertising in South Africa remains a dynamic and increasingly data-driven channel, with rates largely driven by route reach, fleet size, and the presence of digital or wrap formats. As urban centers like Johannesburg, Cape Town, and Durban continue to grow, advertisers can expect transport hubs and high-traffic corridors to command higher base rates while more peripheral routes offer cost-effective opportunities for broad awareness.
Future trends point toward greater use of digital screens on buses, end-to-end DOOH ecosystems, and programmatic buying that ties inventory to real-time demand signals. Dynamic pricing, route-based packages, and time-of-day adjustments are likely to become standard, enabling operators to optimize revenue while offering advertisers flexible, performance-oriented options. Prime routes and peak-hour windows will maintain premium pricing, but longer-term contracts and multi-route bundles can unlock favorable rates through volume commitments.
The market outlook in South Africa is buoyed by ongoing urbanization, improvements in public transport infrastructure, and a growing appetite for measurable out-of-home campaigns. As fleets modernize and city networks expand, more advertisers will shift budgets toward bus media as part of integrated mobility campaigns. Expect gradual rate growth in high-demand metros and greater competition among operators, which could translate into better value-adds for advertisers through bundled services and cross-channel packages.
Technology integration is reshaping the selling and buying of bus media. GPS and telematics provide accurate route and dwell-time data, enabling more precise targeting and performance analytics. Digital signage inside and on the exterior of buses supports dynamic creative rotation, reducing creative fatigue and increasing engagement. Programmatic platforms and demand-side integrations will allow advertisers to buy inventory in real time against audience and context signals, improving efficiency and measurable reach.
Data-driven targeting in this space will leverage anonymized ridership analytics, route-level demographics, and time-of-day patterns to optimize campaign allocation. Combining bus route data with mobile location insights, weather, or event calendars can refine audience segments and allow for context-aware creative timing. Privacy compliance and data governance will be central, with transparent measurement benchmarks and opt-in data practices becoming standard to maintain trust and efficacy.
Pricing considerations will continue to reflect format and exposure. Full-wrap and digital-screen formats command premium rates, especially on flagship routes and during peak periods. Per-route or per-bus pricing models, bundled across multiple corridors, are common, with discounts tied to longer commitments or multi-platform campaigns. Data-driven targeting and attribution capabilities can justify higher CPMs by delivering demonstrable reach, frequency, and ROI when integrated with other media channels.
Overall, South Africa’s bus advertising sector is positioned for steady growth powered by technology and data-enabled targeting. Advertisers can expect more precise audience reach, flexible pricing, and more measurable outcomes as DOOH on transit networks matures, creating compelling value propositions in a cost-conscious market.
Regulatory developments and market evolution
Bus advertising rates in South Africa are influenced by route density, demographic reach, vehicle type, and whether the inventory is static or digital. In major cities like Johannesburg, Pretoria, Cape Town, and Durban, rates tend to be higher on premium corridors with high commuter volumes. Static on-bus ads typically use package pricing per bus per week, while digital screens allow shorter flighting and CPM-based pricing; bundled packages across multiple assets (bus, bus shelters, and digital DOOH) can offer value discounts.
Future trends point to a growing role for digital out-of-home on buses, with more operators installing on-board screens and expanding video capabilities. Programmatic buying and dynamic pricing are likely to become more common, enabling time-of-day, route, and audience-based targeting. Data integration with mobile and location data could improve reach and measurement, making bus ads more accountable. As urban mobility rebounds and transit ridership stabilizes, advertisers may pay premiums for high-visibility corridors and cross-channel campaigns that combine bus with other DOOH assets.
Regulatory developments are shifting the operating environment. In South Africa, compliance with the Protection of Personal Information Act (POPIA) and Advertising Standards Authority (ASA) codes affects data-driven campaigns and factual claims. Local municipal by-laws can govern outdoor advertising display, permit requirements, and allowable formats for bus ads, potentially limiting clutter or imposing size and placement rules. Safety considerations and environmental guidelines may also influence permissible formats and the pace of DOOH adoption on public transport.
Market evolution is likely to see greater consolidation among bus advertising networks and increased competition from adjacent transit media. This could pressure traditional static rates while digital inventory expands, pushing sellers toward standardized pricing and performance-based models. Agencies may favor longer-term contracts with volume commitments and offers that bundle bus, shelters, and other transit media to improve reach and cost efficiency. Cross-media campaigns that integrate data-driven bus advertising with mobile and retail touchpoints will gain traction as marketers seek measurable ROAS.
For brands navigating this environment, the focus should be on route targeting, flexible flighting, and robust measurement, as well as ensuring regulatory compliance. Negotiating packages that align with commuter patterns, seasonality, and event-driven demand can optimize value. As the market digitalizes, incorporating POPIA-compliant data and ASA-aligned creative can help sustain effectiveness and minimize regulatory risk while capitalizing on the evolving pricing landscape for bus advertising in South Africa.