
Overview of Bus Travel Time
Bus travel time is the expected duration of a bus journey from start to finish, shaped by route distance, number and spacing of stops, traffic conditions, and delays caused by incidents, weather, or boarding times. This overview explains how planners measure travel time, why it varies by time of day, and how real-time data and scheduling strategies aim to improve reliability for riders and operators alike.
Definition and Key Metrics
Bus travel time is the total time a passenger spends to complete a trip on a bus route, from boarding at the origin stop to alighting at the destination stop. It includes running time—the time the bus spends moving between stops—and dwell time—the time spent at stops to board and alight passengers—and it is influenced by traffic, signals, incidents, and how closely a service adheres to its timetable. Understanding travel time supports timetable design, service planning, and improving passenger experience through more reliable and predictable trips.
Definitions in transit planning typically distinguish stop-to-stop travel time, which measures the duration from a specific origin stop to a destination stop, and door-to-door travel time, which adds walking segments and transfers. For performance reporting, stop-to-stop travel time on routes is the standard metric used by agencies to quantify how long trips take under typical operating conditions.
The travel time on a bus route can be decomposed into running time and dwell time. Running time is the movement between stops and is affected by vehicle speed, traffic congestion, traffic signals, and road geometry. Dwell time is the time the bus spends at each stop for passenger boarding and alighting, which rises with higher passenger volumes and longer boarding processes. Total stop-to-stop travel time equals the sum of running time and dwell time across all segments of the trip, and can vary from trip to trip due to conditions encountered along the way.
Key metrics used to characterize bus travel time include: average travel time and median travel time, which describe typical trip durations; travel time variance, measured by standard deviation or coefficient of variation, which captures how much travel times fluctuate; and travel time reliability metrics such as on-time performance (OTP), the proportion of trips arriving within a scheduled window, and schedule adherence, the extent to which trips stay within planned departure and arrival times. The travel time index (TTI) compares observed travel time during congested periods to a baseline free-flow travel time, indicating how delays scale with traffic. Additional indicators include average wait time related to headways and buffer time utilization, which shows how often scheduled buffers are needed or used to maintain reliability.
Data sources for measuring bus travel time include GPS-based tracking and automatic vehicle location (AVL) systems, which provide timestamped position data; fare or smart-card data for boarding counts; automatic passenger counters; and GTFS and GTFS-Realtime feeds that store schedule and real-time trip information. Analyzing these data with mapping and statistical methods yields route-level and trip-level travel times, their distribution, and reliability metrics.
Transit agencies use travel time metrics to identify bottlenecks, adjust timetables, and add service or layover time where needed. Strategies to improve travel time include prioritizing buses at traffic signals, implementing express or limited-stop service, redesigning stop spacing, adding buffer time in schedules, and real-time passenger information to manage expectations. For riders, reliable travel time translates to predictable departures, shorter idle waiting, and better confidence in planning trips.
Challenges in measuring and improving bus travel time include traffic variability, incidents, weather, road work, and events that disrupt schedules; data quality issues such as gaps in GPS coverage or incomplete fare data; seasonal effects and day-of-week patterns; and the need to balance reliability with farebox revenue and operating costs while ensuring equity across routes and neighborhoods.
In summary, bus travel time is a fundamental performance measure that encompasses running and dwell times and is shaped by traffic and operations. By defining clear stop-to-stop travel time, calculating central tendency and variability, and tracking reliability metrics with robust data, transit agencies can design better timetables and implement improvements that make bus travel faster, more predictable, and more attractive to riders.
Why Travel Time Matters for Riders and Operators
Bus travel time is the duration from a rider’s origin to their destination on a bus trip, including waiting, boarding, in-vehicle time, and any transfers. It can be planned as scheduled travel time or measured as actual travel time, which varies with traffic, incidents, and passenger demand. Understanding travel time requires looking at its components: wait time before boarding, dwell time at stops, and in-vehicle time between stops.
Why travel time matters for riders: predictable and shorter trips improve reliability, reduce planning uncertainty, and influence mode choice. Riders care about total travel time and the variance, not just the average. Longer or more variable travel times can increase the risk of missed appointments, raise stress, and reduce access for time-sensitive trips such as work or school.
Why travel time matters for operators: Travel time is a key performance metric that affects schedule adherence, fleet utilization, energy use, and operating costs. Operators aim to minimize delays and reduce variability to keep on-time performance high. Travel time data helps planners evaluate route performance, justify service levels, and adjust headways, dwell times, and route alignments.
How travel time is used in service design: Agencies balance speed with coverage, creating express or limited-stop options to trim in-vehicle time on busy corridors while preserving access elsewhere. Dwell time at stops heavily influences reliability, so strategies such as all-door boarding, prepaid fares, and fare integration, along with transit signal priority, can shorten in-vehicle time on congested routes. Travel time forecasts inform trip planning tools and real-time ETA services.
Measuring travel time: Agencies measure actual travel time using GPS data from vehicles, automatic passenger counts, and timetable analyses. Key metrics include average travel time, travel time reliability, and the share of trips arriving on time. Reliability is often defined as the percentage of trips arriving within a specified window around the schedule, and improving reliability boosts rider confidence and satisfaction.
Challenges and improvements: Congestion, incidents, weather, and demand variability create longer and less reliable travel times. Solutions include better traffic management (priority signals, bus lanes), redesigned schedules, dynamic staffing, and enhanced real-time traveler information. Predictive analytics can anticipate delays and guide proactive adjustments to service.
Conclusion: Travel time is central to the rider experience and to the efficiency of transit operations. Reducing average travel time and increasing reliability make bus networks more attractive, help riders save time, and enable operators to deliver more efficient, higher-quality service.
Measuring Travel Time
Measuring bus travel time helps transit planners and riders understand how long a typical journey takes. By tracking in-vehicle speeds, stop dwell times, and the difference between schedule and actual running time, agencies gauge reliability, identify delays, and communicate expected durations. Using GPS data, automated counters, and timetable comparisons, we build a practical picture of bus travel times across routes and times of day, guiding improvements to on-time performance and rider experience.
Data Sources and Collection Methods
Measuring travel time for buses is essential for planning, operations, and rider information. Accurate estimates help schedule adherence, improve reliability, and support real-time traveler updates.
Travel time can be defined as the period a bus takes to travel between defined points on a corridor, such as stop to stop or origin-destination pairs. Reliability measures describe how much actual travel time deviates from planned times, often expressed as percentiles or confidence intervals.
Data sources for bus travel time come from on-board sensors, road-side infrastructure, and third-party data. Primary sources include automatic vehicle location data from GPS or AVL systems that record vehicle positions and times at regular intervals. Complementary sources include Automatic Passenger Counting, fare collection timestamps, and door-open events that help anchor dwell times.
GPS/AVL data provide continuous position traces that can be aggregated into segment travel times. Each segment is defined by a pair of geofenced points or stops, and the travel time is the time elapsed as the vehicle moves from one to the other.
On-board sensors are complemented by off-board data collected from road-side loop detectors, Bluetooth or Wi-Fi probes, and camera-based counts. These probes can capture travel times by detecting a device’s presence across two or more points, enabling inferred speeds on corridors without relying solely on the bus’s own GPS.
Floating methods use data gathered from moving vehicles or devices to estimate travel time without fixed reference points. Floating car methods deploy private vehicles or public transport vehicles equipped with tracking. Floating phone methods rely on anonymized mobile device data. Both approaches help fill gaps where bus sensors are sparse.
Data collection methods vary in granularity and cost. Continuous sensing from AVL provides near real-time travel times, while episodic data collection, such as travel-time runs conducted by staff during different periods of the day, yields stable baselines. Manual timing, stopwatch-based stop-to-stop measurements during field surveys, remain useful for validation.
Processing steps include aligning time stamps, map-matching GPS traces to the road network, and segmenting journeys into predefined links. Travel times are computed per segment and aggregated by time of day and day-of-week. Data quality checks identify outliers, missing values, and sensor malfunctions.
Data quality and privacy are critical. Sensor failures, lane changes, detours, or events such as roadwork can skew measurements. Techniques such as outlier filtering, median-based aggregations, and cross-source validation improve robustness. Privacy concerns require anonymization and aggregation to prevent re-identification of individuals.
Travel-time outputs include average travel time, distributional metrics (e.g., 50th, 90th percentile), and reliability indices like planning time index. Real-time traveler information systems use live travel-time estimates to publish predicted arrival times at stops and to adjust headways under varying traffic conditions.
Challenges include incomplete coverage, data latency, sensor misalignment with the actual road, and changes in service patterns. Weather, incidents, and special events can also rapidly alter travel times, requiring adaptive models and frequent recalibration.
Best practices start with a clearly defined corridor and segment structure, a documented data schema, and a consistent time window for aggregation. Combine multiple data sources to improve coverage, validate results with field checks, and implement automated data quality monitoring.
An end-to-end workflow might begin with data ingestion from AVL/GPS feeds, followed by map-matching and segment travel-time computation. After quality checks, generate time-sliced travel-time statistics and publish to a GTFS-rt feed for real-time updates and as a GTFS static enhancement for schedule planning.
Effective measurement of bus travel time supports better schedules, improves reliability, and enhances rider experience by delivering accurate, timely information and actionable insights for operations planning.
Common Metrics (Average, Median, P95)
Measuring bus travel time helps operators optimize routes, set expectations for riders, and monitor on-time performance. Travel time is typically defined as the duration from a bus leaving the origin stop to arriving at the destination stop on a defined segment or trip, including time spent dwelling at stops and delays. The most common metrics used to summarize travel time are the average, median, and P95 (95th percentile).
- Average travel time
- Definition: arithmetic mean of travel times observed for a set of trips on a segment.
- How to compute: sum of all travel times divided by the number of trips.
- When to use: provides a simple overall target when travel times are roughly symmetric.
- Limitations: highly sensitive to outliers and long delays; can misrepresent typical experience if the distribution is skewed.
- Practical tips: report alongside dispersion (e.g., standard deviation) or a trimmed mean; consider pairing with a measure of the tail.
- Median travel time
- Definition: the middle value of travel times when the data are sorted, so half of trips are faster and half are slower.
- How to compute: sort the travel times and select the central value (or average the two central values for an even count).
- When to use: robust to outliers and skewed distributions; often reflects the typical rider experience more accurately than the mean.
- Limitations: may underrepresent the impact of frequent long delays on reliability metrics.
- Practical tips: report with interquartile range to convey variability; useful when distributions are not normal.
- P95 travel time
- Definition: the travel time below which 95% of trips fall; the remaining 5% exceed this threshold.
- How to compute: order travel times and identify the value at the 95th percentile (with interpolation if needed).
- When to use: highlights worst-case or near-worst-case experiences; helpful for setting service targets and contingency planning.
- Limitations: can be sensitive to data quality and sample size; may overemphasize rare events if the tail is volatile.
- Practical tips: consider additional tail metrics (e.g., P90, P5) for a fuller picture; use in dashboards to flag reliability issues.
Factors Influencing Travel Time
Bus travel time is influenced by a range of factors, from traffic congestion and signal timing to bus frequency, dwell times at stops, and route length. Passenger volumes, boarding delays, and incidents such as accidents or roadworks can add to travel times, while weather, road conditions, and driver behavior also play a role. Advances in scheduling, real-time tracking, and efficient dispatch aim to minimize delays and provide more predictable journeys with buses arriving on time.
Traffic Conditions and Congestion
Bus travel time is shaped by traffic conditions, route structure, and how long a bus spends at each stop.
Traffic conditions and congestion influence average speeds, with delays arising from bottlenecks, crashes, lane closures, and heavy volumes during morning and evening peak periods.
Dwell time at stops includes boarding and alighting, fare collection, passenger crowding, and accessibility needs, all of which can add minutes to a trip, especially on busy routes.
Traffic signal timing and bus priority measures play a crucial role; well-timed signals, dedicated bus lanes, and signal preemption can shave minutes off a trip, while conflicting right‑of‑way demands may slow a bus down.
Weather and road surface conditions affect traction, visibility, and braking, causing buses to operate more cautiously and increasing travel time in rain, snow, or icy conditions.
Incidents and roadworks, such as accidents, disabled vehicles, or construction zones, often trigger detours, lane closures, or speed reductions that extend travel time and reduce reliability.
Route design and network effects matter; shorter inter-stop distances increase dwell time per kilometer, while longer routes with few stops can travel faster but risk greater exposure to congestion further along the corridor.
Fleet reliability, vehicle condition, and driver performance influence travel time; breakdowns, maintenance gaps, or inconsistent driving practices can cause unplanned delays and uneven headways.
Demand patterns and events, including school holidays, large gatherings, or sporting events, create episodic spikes in congestion that can disrupt typical travel times on affected routes.
Route Design: Stops, Spacing, and Detours
Bus travel time is influenced by a mix of factors and route-design choices that together determine how quickly passengers reach their destinations. Understanding these elements helps operators optimize schedules and riders plan trips with more accuracy.
- Traffic conditions and variability: congestion, accidents, construction, and lane closures can cause delays that ripple through a timetable, especially during peak hours.
- Dwell time at stops: time spent boarding, alighting, fare collection, and accessibility needs directly adds to total travel time; higher passenger loads or inefficient procedures increase dwell time.
- Headways and schedule adherence: how often buses run, buffer times in schedules, and the reliability of on-time performance shape perceived and actual travel times for riders.
- Vehicle performance and driver behavior: acceleration, braking patterns, maintenance status, and compliance with speed limits influence speed consistency and stop-to-stop time.
- Road geometry and traffic signal timing: street layout, curvature, grade, and the use of bus priority signals or dedicated lanes can shorten or extend travel time.
- Weather and environmental conditions: rain, snow, ice, fog, and heat affect road safety, traction, dwell times, and incident rates, altering travel time.
- Detours and route deviations: planned detours for events or construction add distance and stops, while unplanned detours can disrupt schedules and reliability.
- Detour design and routing efficiency: where detours divert, how quickly buses rejoin their original path, and the availability of alternative corridors influence total time and consistency.
- Stops spacing and route coverage: dense stop spacing increases access but can slow trips due to more frequent dwell times, whereas wide spacing speeds some riders but reduces convenience and catchment.
- Stop design and passenger flow: curb layout, shelter quality, accessibility features, and loading zones affect boarding times and rider comfort.
- Network structure and transfers: the broader network design, transfer requirements, and alignment with other modes (rail, cycling) impact overall travel time and user decisions.
Vehicle Performance and Scheduling
Bus travel time is shaped by a blend of vehicle performance, passenger dynamics, road conditions, and how services are scheduled. Understanding these factors helps operators design routes that are both timely and reliable for riders.
Vehicle performance influences travel time through acceleration, braking efficiency, and overall powertrain reliability. Heavier buses take longer to reach highway speeds, while poor tire condition or low engine efficiency can slow a run. Electric and hybrid buses add considerations such as battery weight and charging times, which affect range and potential dwell times at maintenance stops or charging bays.
Passenger boarding and alighting contribute significantly to dwell time at each stop. The number of doors, fare collection methods, accessibility features, and crowd levels determine how long passengers spend loading and unloading. In dense urban corridors with many stops, dwell time can become a dominant portion of total trip time.
Route characteristics, including the number of stops, street alignment, and the presence of bus shortcuts or detours, directly impact speed. Frequent turns, heavy curbside loading, and narrow lanes force slower driving, while well-designed bus stops and platform spacing can streamline operations and reduce unnecessary delays.
Traffic conditions and incidents are major drivers of variability in travel time. Congestion during peak hours, lane closures from construction, accidents, and adverse weather all slow buses and can create cascading delays along a corridor.
Scheduling design determines how reliably a bus reaches its expected times. Headways, service frequency, and the use of buffers or recovery time help absorb delays without cascading late departures. Poorly matched headways or insufficient recovery time can amplify the impact of disruptions on downstream trips.
Transit priority measures such as dedicated bus lanes and signal priority reduce delays caused by mixed traffic. When buses are given priority at traffic signals or lane space, travel times become more predictable and consistent, especially on busy arterial routes.
Operational factors, including fleet size, maintenance scheduling, and vehicle availability, influence travel time indirectly. Regular maintenance prevents breakdowns that cause mid-route failures, while insufficient spare buses can lead to longer wait times for replacements and increased pressure on on-time performance.
Data and analytics play a growing role in predicting and managing travel time. Real-time GPS data, traffic feeds, and passenger counters help operators monitor performance, anticipate slowdowns, and dynamically adjust dispatch and routing to maintain reliability.
External factors such as special events, holidays, or school schedules can cause unusual demand patterns and road usage. Anticipating these spikes allows planners to adjust headways or deploy additional vehicles to keep travel times within target ranges.
In sum, bus travel time results from the interaction of vehicle performance, boarding behavior, road and traffic conditions, route design, and strategic scheduling. Balancing efficiency with reliability requires a holistic approach that combines good vehicle maintenance, smart timetable design, and proactive use of real-time information.
External Events: Weather, Accidents, Roadworks
Bus travel time depends on many factors, but external events such as weather, accidents, and roadworks often have the biggest impact on how long a journey takes.
Weather directly affects bus speed and reliability. Heavy rain reduces visibility and road friction, causing slower driving and more cautious schedules. Snow and ice can create slippery streets and traffic disruptions, sometimes forcing detours or temporary service suspensions. Strong winds can affect high-sided buses and cause occasional delays at intersections. Heat can worsen congestion as crowds seek air-conditioned routes and can affect road conditions, occasionally impacting timetable adherence.
Accidents near bus routes can halt lanes, block stops, and trigger delays while responders work and the scene is cleared. Even minor incidents can ripple through a network when routes share corridors, causing detours and backlogged delays as schedules are adjusted and services re-route.
Roadworks reduce available lanes, alter traffic patterns, and change signal timings, which slows traffic and lengthens travel times for buses. Buses may be required to stop at work zones, encounter slower speeds, or be diverted onto detour routes. Timings often depend on the time of day and the stage of construction, with peak hours typically seeing longer delays.
To cope with these disruptions, transit agencies use real-time updates, vehicle tracking, and dynamic routing to keep passengers informed and adjust schedules. Some routes benefit from dedicated bus lanes or priority signals that help buses regain time in congested corridors. Agencies also pad schedules during known risk periods and offer alternative routes, detours, or extra services to reduce the impact on travelers.
Time Management Strategies for Transit Agencies
Effective time management for transit agencies means orchestrating schedules, real-time operations, and rider expectations to minimize bus travel time and reduce delays. By leveraging data analytics to identify bottlenecks, optimizing headways and dwell times, implementing dynamic routing and priority measures on busy corridors, and providing timely rider information, agencies can improve reliability, shorten travel times, and deliver a smoother experience for riders.
Schedule Optimization and Headway Management
Time management for bus travel time hinges on designing schedules and headways that reflect real-world conditions, minimize variability, and reduce rider wait time. Effective strategies blend data, tools, and disciplined operations to keep buses moving on time while accommodating passenger demand.
Collect and analyze travel time data from multiple sources such as GPS, automatic passenger counting, on-board sensors, and periodic travel time surveys. Use this data to establish robust baseline travel times, identify segments with high variability, and monitor changes over time. Regularly update travel time tables to reflect seasonal patterns, incidents, and construction.
Allocate travel time budgets with appropriate slack to absorb delays without cascading reliability problems. Differentiate budgets by time of day, day of week, and corridor. Include buffer time at segments with known variability, such as urban cores, busy bus stops, and high-traffic intersections.
When optimizing schedules, decide between time-based schedules and headway-based service. Time-based schedules aim to meet exact departure and arrival times, requiring tight control of travel times. Headway-based design targets even passenger wait times by maintaining consistent intervals between buses, which often yields better reliability in variable traffic conditions.
Use scheduling strategies that improve reliability: stagger layovers, place recovery times at strategic locations, and build in mid-route slack where traffic patterns are unpredictable. For trunk routes, maintain regular headways while using feeder lines to smooth demand and reduce bottlenecks at transfer points.
Headway management is central to rider experience. Implement policies to maintain even headways, such as holding buses at stops when gaps exceed target thresholds, or dispatching additional service during peak periods. Communicate expected wait times to riders and adjust service dynamically to preserve reliability rather than pushing buses to operate on brittle schedules.
Leverage traffic signal priority and other road network improvements to reduce travel time variability. Transit signal priority, dedicated bus lanes, queue jumps at intersections, and speed harmonization help buses maintain consistent speed and shorter travel times, especially during peak periods.
Control dwell time at stops to protect travel time and headways. Encourage off-board fare payment, door-wide boarding, all-door loading when safe, and efficient alighting. Use smart stop placement and passenger information to minimize time spent at busy stops and reduce door dwell.
Incorporate recovery and contingency planning into every schedule. Plan for contingencies such as unscheduled bus substitutions, incidents, and detours by maintaining reserve vehicles, flexible layover locations, and rapid re-routing procedures to recover headways quickly.
Implement real-time monitoring and adaptive response processes. Use automated alerts to detect deviations from plan, re-dispatch or re-route buses as needed, and communicate changes to operators and riders. Develop clear incident response protocols and a rapid decision-making framework for dispatch staff.
Adopt the right technology stack: GTFS and GTFS-RealTime for schedule and live data, AVL for location tracking, APC for ridership and dwell analytics, and dynamic scheduling software that can adjust headways and layovers on the fly. Visual dashboards help operators, planners, and managers monitor performance and respond quickly to issues.
Best practices include designating corridor-based performance targets, running periodic reliability reviews, and continuously validating assumptions with fresh data. Pilot projects on selected routes can test new slack allocations, headway strategies, and priority treatments before scaling system-wide.
Ultimately, the goal is to minimize travel time and variability while maintaining predictable wait times for passengers. A disciplined combination of data-driven travel time estimation, thoughtful slack budgeting, headway management, traffic improvement measures, dwell time reduction, and agile operations creates a robust framework for more reliable and efficient bus service.
Transit Signal Priority and Traffic Coordination
Bus travel time is a critical driver of rider satisfaction and operating efficiency. Time management strategies for transit agencies must align timetable design, traffic interactions, and passenger demand. A focused approach to Transit Signal Priority and traffic coordination can reduce in-vehicle time, improve reliability, and create predictable trips, particularly on busy corridors.
Data collection and analysis form the foundation of effective time management. Agencies should gather real-time and historical data from GPS/AVL systems, automated passenger counting, dwell time records, and incident logs. Travel time studies across peak and off-peak periods help establish realistic schedules, while reliability metrics such as on-time performance, schedule adherence, and travel time reliability quantify where improvements are needed. Data-driven planning enables targeted buffer management and avoids unnecessary slack that wastes capacity.
Scheduling and headway management must balance service frequency with corridor constraints. Fixed and flexible headways, timepoint-based schedules, and strategic buffer times help sustain reliability when conditions shift. Dwell time reduction through streamlined boarding and off-board fare payment, all-door boarding where appropriate, and predictable ramping of service during peak periods are essential. Recovery strategies, such as service windows for delays and proactive re-sequencing of runs, prevent small delays from cascading into larger schedule gaps.
Transit Signal Priority adapts traffic signals to bus movements to minimize red-light delays. TSP strategies include green extension, early green, and selective phase insertion at key intersections along a corridor. Effective TSP relies on reliable vehicle detection, accurate bus location data, and fast communications between transit operations and traffic signal controllers. While TSP can shave minutes off travel time and improve reliability, it must be implemented with safeguards to avoid excessive delays for cross-street traffic and to maintain pedestrian safety and signal timing harmony across the network.
Traffic coordination goes beyond individual signals to optimize the entire corridor. Coordinated or adaptive signal timing, network-wide green waves, and integration with a traffic management center help align bus progression with overall traffic flow. Sharing data among agencies, aligning incident response, and coordinating with reserved transit lanes or queue-jump opportunities support smoother bus movements. A well-coordinated strategy reduces stops, lowers travel time variability, and improves schedule reliability for riders on high-demand routes.
Operational practices that support faster, more reliable trips include curb management, priority enforcement, and efficient boarding processes. Implementing bus lanes or queue jumps where feasible reduces bottlenecks near stops. All-door boarding and off-board fare collection speed boarding and alighting, lowering dwell times at stops. Clear platform design, predictable stopping locations, and real-time passenger information help riders anticipate service and reduce delays caused by crowding or improper boarding.
Technology and analytics enable continuous improvement. Microscopic simulation tools model bus movements, signal timing, and pedestrian interactions to test TSP configurations and corridor strategies before implementation. Scenario planning with different demand growth, incident conditions, and weather effects helps agencies prepare robust plans. Open data and interoperable systems foster collaboration with municipalities, emergency services, and operators to maintain accurate, timely information about service changes that affect travel time.
Implementation requires careful planning, pilots, and measurable results. Start with a limited corridor, establish clear success metrics (on-time performance, reliability, average travel time, and customer satisfaction), and monitor safety and equity implications. Use a phased rollout with stakeholder input from operators, traffic engineers, unions, and the public. A strong business case should quantify benefits in time savings, reliability improvements, and potential ridership growth, while also accounting for costs of technology upgrades, maintenance, and ongoing coordination efforts.
Resource Allocation and Fleet Management
Time management is essential for transit agencies aiming to improve bus travel time and reliability. By focusing on both running time and dwell time, agencies can reduce variability, improve on-time performance, and shorten passenger wait times across routes.
Start with data collection and analytics. Deploy automatic vehicle location (AVL) and GPS data, fare collection data, and stop-level dwell times to build robust travel-time models. Use these models to establish baseline running times, quantify variability, and set realistic headways and schedule margins.
Optimize corridors through priority measures. Implement transit signal priority (TSP) and queue-jump lanes where feasible, and coordinate traffic signal timing to smooth speeds on high-demand corridors. Consider speed harmonization and limiting stop density on arterials to reduce overall running time without sacrificing accessibility.
Strategic fleet allocation and vehicle assignment. Align fleet size and composition to demand on each route, and maintain a spare ratio to absorb delays. Use optimization tools to assign vehicles to routes in a way that minimizes running time and deadheading while respecting maintenance windows and driver hours.
Dwell-time reduction and boarding efficiency. Move toward all-door boarding with off-board fare payment, prioritize prepaid tickets, and upgrade boarding platforms to minimize dwell. Reducing the time buses spend at stops has a direct impact on running time and schedule reliability.
Driver scheduling and workforce management. Design rosters that align with peak demand and minimize deadhead and layovers. Cross-train drivers for multiple routes, maintain a reserve pool for contingencies, and track adherence to schedules to prevent cascading delays during peak periods.
Maintenance and reliability program. Implement preventive and predictive maintenance to reduce unplanned breakdowns that disrupt service. Schedule maintenance during off-peak windows and assign standby units to avoid service gaps when a vehicle must be removed from service.
Real-time management and contingency planning. Use real-time data to monitor OTP, travel times, and passenger loading, enabling dynamic headways and short-notice service adjustments. Develop incident response playbooks and diversion plans to maintain reliability during incidents or heavy traffic.
Asset management and energy considerations for fleets. For electric or alternative-fuel buses, optimize charging schedules and depot locations to avoid range-related delays. Plan for charging in a way that minimizes downtime, and consider route-level energy consumption when assigning vehicles to runs.
Implementation roadmap and metrics. Start with a pilot on a high-frequency corridor, measure KPI improvements such as on-time performance, travel-time index, and headway adherence, then scale successful practices across the network. Use dashboards to communicate progress to operators and riders and to drive continuous improvement.
Communicating Travel Time to Passengers
Communicating travel time to bus passengers means providing clear, timely estimates of when a bus will reach stops and destinations. Effective methods include real-time onboard displays, public announcements, mobile apps, and service notices that explain variability due to traffic, stops, or incidents, using plain language like “about 8 minutes” or “in roughly 15 minutes.” Consistency, transparency, and frequent updates help riders plan, reduce frustration, and improve overall experience.
Timetables and Predictive Arrivals
Communicating travel time to passengers on bus networks involves clear timetables, real-time updates, and reliable predictive arrivals. The aim is to help riders plan, reduce uncertainty, and improve satisfaction.
- Present times in minutes or hour and minutes as appropriate, avoiding ambiguous wording
- Display both scheduled times and estimated arrivals when available
- Refresh real-time information frequently and indicate the time of the last update
- Show a confidence window (for example: ETA 6–8 minutes)
- Provide accessibility-friendly formats (high contrast, large fonts, screen-reader friendly)
Timetables and predictive arrivals should be aligned across all channels, including stop displays, mobile apps, and voice services. Use live data feeds to update ETAs and communicate expected delays clearly.
- Publish ETAs at each stop for all routes and ensure consistency across signs, apps, and journeys
- Indicate today’s headways and expected variation during peak and off-peak periods
- When delays occur, provide updated ETAs and estimated time to service recovery
- Offer alternative options or routes if delays are lengthy, including walking or different stops
- Explain the reliability of predictions and any uncertainty ranges
Best practices for implementation include testing messaging with actual riders, using plain language, and updating policies as data quality improves. Regular audits ensure information remains accurate, timely, and accessible.
Real-Time Tracking and Notifications
Communicating travel time to passengers is a core part of a reliable bus service. By combining real-time tracking with timely notifications, operators can set accurate expectations, reduce crowding at stops, and improve rider satisfaction.
Real-time tracking relies on GPS data from each bus, onboard telematics, and central processing that converts location into travel time estimates. Visualizing the bus’s progress on a map and calculating ETA based on current speed, road conditions, and detours helps create credible, passenger-friendly information.
To deliver travel times to riders, transit agencies publish ETA information at multiple touchpoints: dynamic stop displays, in-bus screens, mobile apps, agency websites, and SMS alerts. This multi-channel approach ensures riders can check status the way they prefer.
ETA feeds can originate from GTFS-Realtime feeds such as TripUpdate and VehiclePosition, supplemented by predictive models that account for traffic patterns and historical travel times. Updates should be frequent enough to reflect changing conditions, typically every 15 to 30 seconds for on-board displays and every few minutes for stop signage, with exceptions during service disruptions.
Message design matters: use clear language, round times to the nearest minute, and present a single ETA per bus. Include context such as “in approximately 7 minutes” or “bus arriving at Stop A at 10:23.” Avoid conflicting or overly precise times that can mislead riders when conditions are changing rapidly.
Accessibility and multilingual support are essential. Provide translations for common routes, offer high-contrast displays, large readable fonts, and consider audio announcements for visually impaired riders. Ensure ETA content is accessible to screen readers and compatible with assistive devices.
Privacy and data governance should guide the system design. Share travel time using anonymized vehicle positions and aggregated data, avoiding the collection or display of sensitive personal information. Clear privacy notices help riders trust the service.
Operational considerations include regular calibration of ETAs against actual arrivals, QA testing before new feeds go live, and procedures for detours, roadworks, or weather events. Establish fallback ETAs when data feeds fail and provide transparent notes about disruptions.
From a user experience perspective, balance the volume of notifications with usefulness. Allow riders to opt in to notifications, choose preferred channels, and keep messages concise. Use consistent units (minutes) and simple phrasing to minimize confusion across routes and languages.
Key metrics to monitor include ETA accuracy, notification adoption rate, average update latency, and rider satisfaction. Track missed connections and adjust models or data sources accordingly to maintain reliability.
Implementation typically starts with a pilot on a subset of routes, integrating GPS data, GTFS-Realtime feeds, stop displays, and a companion mobile app. Gather rider feedback, validate ETA accuracy against actual travel times, and scale gradually to the full network while maintaining a feedback loop for continuous improvement.
Impact of Technology on Travel Time
Technology is changing how long it takes to travel by bus by turning variable traffic into predictable patterns. Real-time data from GPS, traffic sensors, and commuter apps lets operators adjust schedules, optimize routes, and provide riders with accurate arrival estimates. Smart buses, digital signaling, and predictive analytics reduce delays at stops and in congested corridors, making travel times more reliable even in busy cities.
GPS, AVL, and Data Analytics
Technology is reshaping how buses move people and how travel time is managed. GPS, AVL, and data analytics together influence every leg of a bus trip, from planning to on-road performance and rider information.
GPS provides continuous location data and speed, enabling real-time ETAs, dynamic route adjustments, and transparent rider information through apps and bus stop displays.
AVL integrates GPS data with a centralized system to monitor fleet movements, calculate headways, detect schedule deviations, and trigger dispatch actions to keep service on track, thereby reducing travel time delays.
Data analytics turn streams of GPS and AVL data into actionable insights: historical travel times, dwell times at stops, congestion patterns, and incident impact. This supports better timetable design, maintenance planning, and peak-period operations.
Together these technologies reduce travel time variability and improve reliability. Real-time updates help operators make faster decisions, while predictive models allow agencies to anticipate congestion and adjust service proactively, shortening otherwise long delays.
However, challenges remain: GPS gaps in dense urban corridors, signal errors in tunnels, data quality and integration across disparate systems, privacy considerations, and the costs of sensors, software, and staff training.
Operational constraints also matter: weather, road incidents, and limited bandwidth can affect data streams and response times, and not all corridors benefit equally from priority signaling or adaptive routing.
Future developments include AI-driven demand forecasting, machine learning for arrival estimates, vehicle-to-infrastructure communication for bus priority at signals, and integrated platforms for multi-modal journey planning.
In summary, technology lowers travel time for buses by improving information, coordination, and planning, while offering a path to more reliable and efficient urban mobility.
Automation and Future Technologies
Technology reshapes bus travel time by improving planning, reliability, and the speed with which buses move through cities.
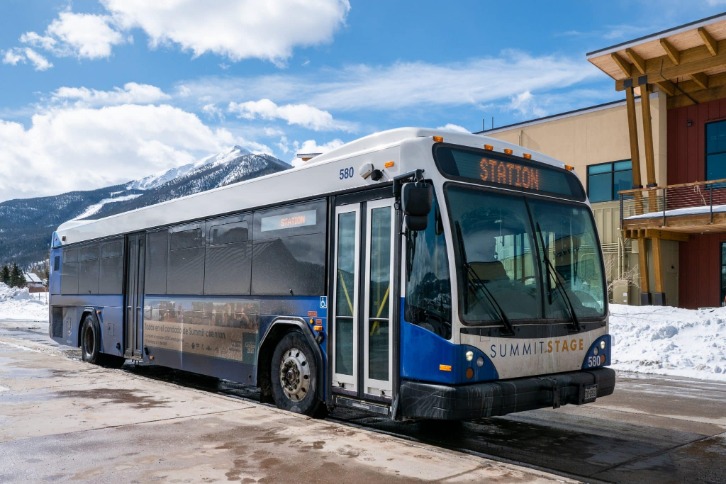
Real-time data from GPS, connected sensors, and traffic feeds allows dispatchers and onboard systems to adjust routes and schedules on the fly, reducing delays and smoothing peak-time operations.
Smart traffic signals and transit signal priority give buses a green head start at busy intersections, shaving minutes off trips and improving on-time performance.
Automation and driverless buses are being tested to streamline operations, with features like platooning and precise acceleration and braking that reduce variability in travel time.
Automation also brings challenges, including safety considerations, regulatory hurdles, public acceptance, and the need for new maintenance ecosystems to support autonomous fleets.
Electrification affects travel time through charging requirements and dwell times; strategies such as opportunity charging at stops or fast charging along corridors help keep buses on schedule and maintain consistent headways.
Future technologies like 5G/6G connectivity and vehicle-to-everything links enable AI-driven route optimization, predictive maintenance, and digital twins that model traffic to minimize delays.
Urban planning and policy, including dedicated bus lanes, bus-only corridors, and congestion pricing, align infrastructure with technology to sustain lower travel times for bus travelers.
Overall, the synergy of automation, connectivity, and smarter infrastructure points toward a future with shorter and more reliable bus journeys.
Case Studies and Real-World Examples
Case studies and real-world examples illuminate how bus travel time is shaped by factors like traffic congestion, dwell time at stops, signal timing, and route design. They show how transit agencies measure punctuality, test interventions such as dedicated lanes or bus-priority signals, and share lessons that help riders plan trips more reliably.
Urban Bus Network: Reducing Variability
Case studies show that reducing variability in bus travel time improves reliability and rider satisfaction. Urban networks worldwide use a mix of infrastructure, operating practices, and technology to smooth travel times.
Curitiba, Brazil, pioneered bus rapid transit with dedicated lanes, off‑board fare, level boarding, and centralized control. The result was more predictable travel times, with reduced variability and fewer random delays.
Bogotá TransMilenio uses a large network of dedicated corridors, prioritized signal timing, and frequent service. Its reliability improvements come from separating most buses from general traffic and standardizing headways, reducing bus bunching.
London has implemented bus priority corridors, bus lanes, and traffic signal priority managed through a centralized system. On major routes, reliability improved as buses encountered fewer delays and headways remained closer to plan.
Singapore integrates bus services with urban traffic management, including queue jump and bus priority at signals and real-time passenger information. The system reduces dwell time and keeps buses moving, decreasing travel-time variability.
Shenzhen and other Chinese cities operate large BRT networks with dedicated lanes and robust management centers; real-time data and coordinated signal timing reduce variability across the network.
In North America, cities such as Seattle and Los Angeles have deployed rapid bus corridors with dedicated lanes, transit signal priority, and, where feasible, all-door boarding. These changes cut down on unpredictable delays and help maintain regular headways.
Key techniques used across these examples include dedicated lanes; signal priority; off-board fare collection; centralized control and real-time data; flexible headways; and improved dwell-time management. Real-world challenges include capital costs, complex intersections, and interagency coordination, but clear targets and continuous data-driven adjustments drive success.
Takeaways for urban networks: prioritize corridors with the highest variability; invest in reliable priority systems; combine infrastructure with operations software; measure on-time performance and headway reliability; and provide real-time information to passengers to sustain confidence in travel times.
Suburban Routes: Balancing Coverage and Time
Suburban bus networks face the challenge of providing broad coverage without sacrificing travel time. Case studies and real‑world examples show how agencies balance route coverage with reliability and speed, using a mix of trunk routes, feeder services, and modern operation practices to improve bus travel time in sprawling suburbs.
Case study: a mid-sized metropolitan area redesigned its suburban network around a few high-frequency main lines that traverse dense suburbs, with feeder routes feeding into limited-stop services. By concentrating trips on arterial corridors, dwell times were reduced at hubs, transfers were simplified, and overall trip times on core corridors shortened while new weekend coverage expanded access to previously service-poor neighborhoods.
Case study: in a low-density suburban fringe, planners replaced some fixed routes with demand-responsive microtransit in evenings and weekends, preserving coverage where fixed routes were too sparse while keeping costs in check. The microtransit nurtured access to essential destinations and major hubs, and riders reported reliable service during off-peak hours, easing commute options without bloating the schedule.
Real-world example: many cities have implemented bus rapid transit features on suburban corridors, including signal priority, all-door boarding, level boarding, and enhanced station amenities. These elements compress travel time, improve reliability, and boost perceived service quality, encouraging riders who previously used cars to switch to bus travel for longer suburban commutes.
Real-world example: stop spacing and dwell-time management play a pivotal role. Agencies reduce dwell time by boarding through multiple doors, off-board fare collections, and shorter, well-designed stops. In dense suburbs, services may cluster at supervised hubs where passengers transfer to limited-stop routes, preserving speed on primary corridors while maintaining neighborhood access.
Case studies also highlight the importance of data-driven decisions. Agencies use ridership data, travel-time studies, and passenger surveys to identify high-coverage gaps and long waits. Simulation tools help test different configurations of trunk routes and feeders, balancing the number of routes with service frequency to maintain predictable travel times while ensuring that suburban residents have reasonable access to jobs, schools, and services.
Key lessons include prioritizing core corridors with frequent service, leveraging modern technology to streamline boarding and priority signals, and maintaining flexible feeder networks that can scale with demand. The most successful suburban networks provide reliable travel times on main lines while offering broad coverage that reaches neighborhoods without forcing long detours. This balance supports mode shift, equitable access, and more predictable daily travel for riders in sprawling suburbs.
Best Practices and Policy Considerations
Best practices for managing bus travel time combine data-driven timetable design, reliable service delivery, and operational efficiency. Policy considerations address equity, funding, accountability, and the trade-offs between speed, reliability, and rider comfort. Key measures include priority at signals, dedicated bus lanes, real-time information, and performance targets that reflect both peak and off-peak conditions. By aligning practices with policy goals, jurisdictions can improve predictability for riders while managing costs and congestion.
Customer-Centric Scheduling
Effective bus travel time management blends rigorous data with a strong customer focus. Best practices in planning and policy considerations center on reducing variability in travel time, shortening the time riders spend waiting, and ensuring predictable, accessible journeys across the network.
Best practices in measuring and predicting travel time begin with robust data collection. Agencies should use automated vehicle location data, passenger-count data, traffic feeds, and weather information to compute on-time performance, travel time reliability, and headway accuracy. Regularly refresh models with recent data to reflect changing road conditions and demand patterns.
Service design should translate travel-time improvements into concrete schedules. Corridor-based planning, targeted headways, and peak-period prioritization help ensure riders experience consistent travel times. Managing dwelling time at stops, optimizing stop spacing, and employing bus-priority measures (such as signal priority or queue jump lanes) can dramatically reduce overall travel time and variability.
Real-time information is essential for customer-centric scheduling. Providing accurate ETAs, service alerts, and disruption notifications helps riders plan transfers and reduces perceived waiting. Integrate with multimodal apps and ensure language accessibility and disability accommodations.
Equity and accessibility must be embedded in policy. Travel-time benefits should be shared across neighborhoods, with special attention to underserved areas where longer or less reliable trips can widen gaps. Fare integration, low-cost options, and reliable service on essential routes help maintain mobility for all residents.
Policy considerations include performance-based funding, accountability, and transparency. Governments can set clear targets for on-time performance, punctuality, and reliability, publish performance dashboards, and require regular independent audits. Policies should also encourage data sharing between agencies, municipalities, and operators while protecting rider privacy.
Environmental and workforce policies influence travel time by shaping fleet reliability and efficiency. Supporting a transition to clean fleets, improving charging infrastructure for electric buses, and adhering to reasonable driver work hours improve reliability and safety, which in turn improves travel time for customers.
Implementation challenges require resilience planning. Weather, incidents, congestion, and roadwork can destabilize schedules. Agencies should run scenario testing, maintain spare capacity on critical routes, deploy temporary timetables during disruptions, and invest in driver training and incident response protocols to minimize travel-time impacts.
Measuring success goes beyond punctuality. Customer satisfaction, perceived travel time, transfer convenience, and equity indicators should be tracked. Regularly solicit rider feedback and use it to adjust schedules, information services, and policy levers to keep a customer-centric approach at the core of scheduling decisions.
In sum, best practices and policy considerations for customer-centric scheduling in bus networks emphasize data-informed planning, speed and reliability improvements on key corridors, transparent performance reporting, and a commitment to equitable, accessible, and sustainable travel time reduction for all riders.
Reliability Targets and Performance Reporting
Reliable bus travel time is a cornerstone of an accessible and efficient transit system. Best practices integrate data-driven measurement, clear performance targets, and transparent reporting to improve rider experience and system reliability.
Best practices for managing bus travel time include establishing standardized metrics such as travel time reliability, on-time performance, and headway adherence; deploying automated data collection from Automatic Vehicle Location systems and passenger counting; using real-time feeds to monitor progress; designing schedules and headways that reflect variability and provide buffers; implementing bus priority measures such as signal priority, dedicated lanes, and coordinated traffic management to reduce delays; and maintaining data governance to ensure consistency across operators and agencies with clear roles and accountability.
Policy considerations should address equity in service reliability, ensuring that improvements benefit all neighborhoods, especially high-need areas, while aligning with land-use planning and transit-oriented development. Policies should protect rider privacy and data security, define service standards and funding incentives tied to reliability, and balance efficiency with safety and accessibility. Procurement and contracting should reward reliability improvements, and governance should support cross-agency coordination for corridors that span multiple jurisdictions.
Reliability targets should be SMART: specific, measurable, achievable, relevant, and time-bound. Establish baselines for each route or corridor and set targets for travel time reliability, on-time performance, and headway consistency. Typical targets might require a high percentage of trips to meet a defined on-time window and a capped level of travel time variability. Targets should be reviewed quarterly and adjusted based on changes in demand, traffic patterns, and capital investments.
Performance reporting should be transparent and actionable. Use internal dashboards for operators and planners and public dashboards for riders and elected officials. Reports should cover route-level and time-of-day performance, including average travel times, variability, on-time percentages, cancellations, and disturbances. Include trend analyses, root-cause summaries, and recommended interventions. Tie performance reporting to service planning decisions, capital investments, and policy investments, and publish periodic updates to maintain accountability and public trust.
Implementation considerations include ensuring data quality, interoperability, and governance across agencies and operators. Protect rider privacy when sharing data and establish data-sharing agreements that clarify responsibilities. Build capability through staff training, robust data validation, and change management. Start with pilot programs to test reliability improvements, such as targeted signal priorities or dedicated bus lanes, and scale successful approaches while monitoring cost-benefit outcomes.
Future Trends in Bus Travel Time Management
Future trends in bus travel time management are shaping faster, more reliable service through real-time data, smart scheduling, and predictive analytics. Advances such as GPS tracking, AI-based demand forecasting, and dynamic routing enable precise arrival estimates and adaptive timetables, while traffic signal priority, dedicated bus lanes, and bus rapid transit corridors help reduce congestion. Electrification and autonomous or semi-autonomous buses promise cleaner operations and tighter schedules, complemented by integrated travel apps that provide seamless multimodal planning and up-to-date passenger information.
Smart Infrastructure and ITS
Future trends in bus travel time management, smart infrastructure, and ITS point toward more reliable, faster, and rider-friendly services. The core idea is to turn data into timely actions that keep buses on schedule and improve predictability for travelers.
Real-time data collection from GPS, transponders, cameras, and road sensors will feed advanced analytics and predictive models. Fusing these data streams with weather, events, and incidents enables near-term travel-time forecasts, dynamic headway management, and proactive rerouting rather than reactive adjustments.
Transit priority through traffic signal optimization and dedicated corridors will be key. Transit Signal Priority, queue jumping, and signal timing harmonization reduce dwell and detention times at intersections, especially during peak periods. Bus rapid transit (BRT) corridors and curbside priority lanes will extend this effect.
Smart infrastructure and connected corridors will deploy IoT devices, pavement sensors, dynamic message signs, and vehicle-to-infrastructure communication to monitor conditions and guide operations. Digital twins of bus corridors will simulate scenarios for maintenance, incidents, and service planning, enabling rapid decision support.
Integrated ITS platforms will apply AI and optimization algorithms to scheduling, headway management, and disruption response. Real-time re-routing, platoon formation, and service recovery strategies will be tested and deployed at scale, reducing cascading delays.
Electrification introduces new travel-time dynamics. Battery electric buses require charging windows and energy-aware planning. Opportunity charging at depots or along the corridor, smart charging, and energy recovery strategies will minimize dwell time impact and keep schedules on track.
Standardization and interoperability are foundational. Open formats like GTFS, GTFS Real-Time, and SIRI enable data sharing across agencies and apps. Privacy-preserving data practices, cybersecurity, and governance frameworks will ensure trust and resilience while enabling broad data use.
Passenger-centric ITS will support MaaS and better information through mobile apps, multimodal trip planning, and real-time ETAs. Predictable travel times enable reliable transfers, mode choice, and improved accessibility for riders with disabilities.
Resilience and performance management will be prioritized with incident management, proactive maintenance, and resilience planning. Agencies will track KPIs such as reliability, on-time performance, headway adherence, and average travel times, and use dashboards to communicate results to the public.
Ultimately, the future of bus travel time management rests on coordinated investment in technology, data governance, and cross-sector collaboration among transit agencies, city agencies, operators, and communities to deliver faster, greener, and more equitable bus service.
Resilience and Disruption Preparedness
Future trends in bus travel time management are set to redefine reliability, efficiency and passenger experience. Cities are increasingly leveraging data-driven approaches to synchronize schedules with real-world conditions, reducing wait times and improving on-time performance. The focus is shifting from rigid timetables to adaptive, resilient systems that respond to variability in traffic, incidents and demand.
Real-time data streams from GPS, vehicle diagnostics, fare collection and traffic sensors enable dynamic headway management, route adjustments and priority at signalized intersections. Advanced analytics and artificial intelligence forecast delays, reallocate resources, and trigger proactive mitigations before disruption compounds. These capabilities support smoother operations and more predictable travel times for riders.
Predictive maintenance and asset management are central to minimizing unplanned downtime. By analyzing engine health, tire wear and route usage patterns, operators can schedule maintenance before faults occur, thereby reducing breakdowns that ripple through networks and degrade travel times. This shift from reactive to proactive maintenance enhances reliability and reduces the cost of delays.
Resilience is increasingly embedded into planning through scenario analysis, simulations and digital twins of entire networks. Operators test how networks respond to weather events, major incidents, or demand surges, and refine recovery plans accordingly. Digital models help optimize detours, rerouting and the allocation of spare vehicles to maintain service levels during disruptions.
Disruption preparedness emphasizes rapid recovery and transparency. Flexible crew assignments, cross-border interchanges, and reserve vehicle pools enable quick restoration of service after an incident. Real-time passenger alerts and ETA updates build trust, making riders more tolerant of unexpected changes when information is timely and accurate.
On-demand and demand-responsive services are shaping the future of bus networks. Micro- networks and flexible routing complement fixed lines, allowing for rapid rerouting to meet shifting demand while preserving overall network efficiency. Integrated platforms that match rider needs with available capacity can reduce travel times during peak periods and in congested corridors.
Multi-modal integration and smart corridors are accelerating as buses become part of a broader mobility ecosystem. Coordinated scheduling with rail, tram and shuttle services minimizes transfers and reduces total travel time. Priority lanes, signal optimization and shared optimization models help maintain reliability across modes, particularly in dense urban cores.
Passenger information systems are becoming more sophisticated and ubiquitous. Real-time updates, predictive ETAs and transparent delay reasons empower riders to plan alternatives. Accessible information in multiple languages and channels ensures that disruptions do not disproportionately affect certain user groups, supporting equitable service.
Policy and governance frameworks are adapting to enable data sharing, collaboration and innovation while protecting privacy and security. Standardized data formats, open interfaces and clear accountability improve coordination across agencies and operators. Investment in skilled staff and robust cyber and physical security measures is essential to sustain trust in future systems.
In sum, the future of bus travel time management rests on intelligent data use, proactive maintenance, resilient planning and integrated mobility. By embracing adaptive scheduling, disruption readiness and multi-modal coordination, cities can deliver faster, more reliable and more resilient bus networks that meet the evolving needs of urban travelers.