
Overview of Bus Travel Feedback
Overview of bus travel feedback: Passenger input helps transit agencies assess service quality, identify issues across routes and schedules, and guide improvements that make commuting safer, faster, and more comfortable for riders.
Purpose of Feedback
Bus travel feedback is the information collected from riders about their experiences with bus services. It helps operators understand what is working well and what needs improvement, guiding service design and customer support.
- What feedback covers: routes, scheduling, reliability, comfort, safety, accessibility, and staff interactions.
- Methods of collecting feedback: surveys on board, mobile apps, website forms, call centers, social media, and in-person comments.
- Purpose of feedback: to identify trends, prioritize improvements, measure service quality, and monitor passenger satisfaction.
- Benefits to riders: better service, shorter wait times, cleaner buses, friendlier staff.
- Impact on operations: changes to routes, timetables, vehicle allocation, maintenance scheduling, and training programs.
- Key metrics often tracked: on-time performance, crowding levels, customer satisfaction scores, complaint resolution time.
- Best practices for feedback programs: ensure anonymity, provide quick responses, close the feedback loop by communicating actions taken.
Effective use of bus travel feedback fosters continuous improvement and helps build trust between riders and transit providers.
Scope and Limitations
Overview of bus travel feedback involves collecting and analyzing input from riders and other stakeholders to understand how bus services perform, how they feel about the user experience, and where improvements are needed. This feedback helps transport authorities, operators, and policymakers gauge service quality, prioritize investments, and measure progress against performance goals.
Scope of bus travel feedback includes a wide range of topics such as timeliness and reliability, route coverage and accessibility, service frequency and capacity, fare affordability and transparency, comfort and cleanliness, accessibility for people with disabilities, safety and security, information provision (schedules, real-time updates, wayfinding), and the effectiveness of customer service channels. It also encompasses feedback on digital tools like mobile apps, contact centers, and feedback portals, as well as the overall perception of value for money and trust in the bus network.
Feedback can be collected through multiple channels, including formal surveys, complaint and praise logs, rider interviews, focus groups, in-app or website forms, social media monitoring, on-bus feedback terminals, and analytics from ticketing and journey-planning systems. Combining quantitative indicators with qualitative comments helps create a fuller picture of rider experiences and service performance across different times, routes, and user groups.
Analysis and use of bus travel feedback involve aggregating data, benchmarking against targets, and segmenting results by route, time of day, rider type, or geographic area. Findings are translated into actionable insights, such as adjusting timetables, rerouting, allocating resources, improving information systems, training staff, or launching targeted accessibility and safety initiatives. Transparent reporting and regular follow-up with stakeholders are important to turn feedback into measurable improvements.
Limitations of bus travel feedback include potential response bias, where more engaged or dissatisfied riders are overrepresented, and underrepresentation of certain groups such as infrequent riders or non-native language speakers. Data quality issues, inconsistent sampling methods, and delays in collecting or acting on feedback can reduce timeliness and reliability. Privacy considerations, data integration challenges, and the difficulty of isolating the impact of a single change from other factors can also constrain conclusions.
Scope limitations should be acknowledged, as feedback often reflects local experiences and may not generalize across an entire network. Not all aspects of service are equally easy to measure, and some qualitative impressions may require careful interpretation to translate into concrete actions. Operational constraints, budget cycles, and regulatory requirements may affect the ability to implement feedback-driven changes promptly.
In summary, bus travel feedback is a valuable tool for understanding rider experiences and guiding service improvements, but its value depends on representative data, rigorous analysis, and transparent use of findings within the constraints of scope and limitations. Sustained collection, clear reporting, and ongoing collaboration among operators, regulators, and riders help ensure feedback leads to meaningful enhancements in the bus network.
Methods for Collecting Feedback
Effective methods for collecting feedback from bus travelers help transit providers gauge punctuality, comfort, accessibility, and overall satisfaction. Common approaches include brief on-board surveys or rating prompts, QR codes placed on buses that riders can scan to submit quick responses, mobile apps and SMS surveys after trips, and periodic follow-up emails or calls to capture more detailed input. Analyzing this feedback enables agencies to identify trends, prioritize improvements, and enhance the travel experience for all riders.
Passenger Surveys
Collecting feedback from bus passengers helps transit agencies improve reliability, safety, and rider experience. Effective passenger surveys reach diverse riders, are easy to complete, and translate into actionable improvements.
- Online surveys distributed by email, SMS, or through the transit app
- In-bus QR codes that link to quick surveys at the end of a trip
- Mobile app surveys that trigger after a ride or when a user opens the app
- SMS feedback prompts sent after a trip, especially for riders without smartphones
- Paper surveys available on buses, at stops, and in waiting lounges
- Interactive kiosks or tablets at major hubs or transit centers
- Onboard staff prompts and quick handout forms for riders who wish to provide feedback
- Telephone surveys for selected riders or those who opt in
- Focus groups and in-person interviews with rider segments such as daily commuters or tourists
- Net Promoter Score questions to gauge overall willingness to recommend the service
- Post-ride emails or app messages with a short survey link
- Social media monitoring and comment analysis to capture unsolicited feedback
- Feedback forms on the agency website and a dedicated feedback portal
Onboard Feedback Devices
Effective bus travel feedback helps transit agencies improve reliability, safety, and rider satisfaction. This article covers methods for collecting feedback and how to onboard feedback devices on buses to gather timely, actionable insights.
- Onboard touchscreens and self-service kiosks: install durable, easy-to-use panels at key locations on buses to allow riders to quickly rate cleanliness, comfort, and route experience with options such as 1–5 stars and brief comments.
- Voice-assisted feedback: implement multilingual audio prompts that guide riders to provide feedback after their trip or at stops, with simple keypad or voice options to submit ratings and comments.
- Physical feedback buttons: provide simple up/down or star-rating buttons near exits, complemented by a quick follow-up survey on a rider’s phone via a displayed QR code.
- QR codes and mobile surveys: place QR codes on seats or windows that riders scan to open mobile-friendly surveys; auto-fill context like bus number, route, and trip time for richer data.
- SMS and short-code feedback: offer a text-based option for quick ratings or comments, with automated acknowledgments and optional links to longer surveys.
- Mobile app integration: leverage a transit app to collect route-level and driver-level feedback, with post-ride prompts and privacy-respecting, optional rider identity features.
- Driver and staff prompts: train drivers and conductors to encourage riders to share feedback at the end of trips, ensuring data is linked to route and vehicle while protecting privacy.
- Post-ride surveys via email or SMS: for riders who opt in, send follow-up surveys after trips to gather detailed insights on scheduling, reliability, and facilities.
- In-vehicle analytics and dashboards: provide operators with real-time and historical feedback dashboards by route, time of day, and vehicle to support rapid service adjustments.
- Stop-based and depot feedback channels: collect input at bus stops or depots using kiosks or surveys to surface issues like wait times, arrival accuracy, and safety concerns.
- Privacy and consent: offer clear opt-in/opt-out choices, explain data usage, and anonymize responses to protect rider privacy; provide multilingual terms.
- Onboarding and device maintenance: plan regular maintenance, battery checks, screen cleaning, and firmware updates; assign staff for device health and data sync.
- Data quality and closed-loop follow-up: implement validation and deduplication, and ensure critical issues trigger alerts to operations teams with rider updates on issue resolution.
Online Reviews and Social Media
Collecting feedback is essential for improving bus travel experiences, shaping service improvements, and guiding staff training. A well-rounded approach combines in-journey prompts, post-trip surveys, and active engagement on online review platforms and social media to capture a complete picture of passenger needs and satisfaction.
In-ride feedback can be collected through multiple channels. Seatback or window QR codes can link passengers to brief surveys, while on-board Wi‑Fi portals or mobile apps can present quick rating prompts after key moments such as boarding, mid-journey, and arrival. Short, context-specific questions help capture immediate impressions rather than relying on distant recollections.
Post-trip surveys are effective for gathering deeper insights. Send brief questionnaires by email or SMS within 24 hours of a trip, asking about overall satisfaction, punctuality, comfort, cleanliness, and value. Include Net Promoter Score (NPS) questions alongside a few open-ended prompts to understand drivers, routes, or facilities that stood out—positively or negatively.
Use concise survey design to maximize completion rates. Limit to 5–8 questions, use a mix of rating scales and open-ended fields, and provide a clear purpose and approximate completion time. Include optional demographic or trip-specific questions to segment results for route planning, fleet maintenance, and staffing decisions, while preserving passenger privacy.
Online reviews and listings are critical in shaping the reputation of a bus service. Encourage reviews on popular platforms such as Google Maps, travel apps, and regional transit directories. Provide easy-to-find links in confirmations, on receipts, and on your website, and remind passengers that honest feedback helps improve service for everyone.
To optimize reviews, guide passengers on what to emphasize, such as punctuality, comfort, fare value, or helpful staff, while avoiding pressure to post a positive review. Make it easy to leave feedback by offering a simple one-question rating with an optional brief comment, and consider follow-up prompts after a completed trip rather than broad, generic requests.
Responding to reviews promptly and professionally is essential. Thank positive reviewers, address specific points raised in constructive feedback, and avoid defensiveness when addressing negative comments. Public responses should acknowledge the issue, outline steps being taken, and invite the reviewer to continue the conversation privately if needed.
Social media monitoring helps you hear real-time passenger sentiment and identify trends or issues before they escalate. Track mentions across channels such as Facebook, Instagram, X (formerly Twitter), and regional networks. Use social listening to identify recurring complaints, praise for particular routes, or emerging opportunities to celebrate staff and improvements.
Engagement strategies on social media include posting regular updates about service changes, delays, and improvements, hosting Q&A sessions with operations staff, and inviting passengers to share photos and stories from their trips. Create branded hashtags for campaigns, such as route highlights or seasonal promotions, to encourage user-generated content and feedback.
Encourage feedback through social campaigns that acknowledge passenger voices. Run prompts after trips asking what helped most, what could be better, and suggestions for new routes or amenities. Share select testimonials publicly (with permission) to demonstrate that feedback leads to action, and highlight changes that resulted from passenger input.
Effective feedback programs integrate data from in-ride prompts, post-trip surveys, online reviews, and social media into a unified workflow. Establish dashboards for per-route and per-vehicle performance, track trends over time, and set measurable targets for response times, improvement cycles, and customer satisfaction scores.
Privacy and compliance matter in all feedback activities. Obtain opt-in consent for surveys and messaging, clearly explain how feedback will be used, and implement data minimization practices. Anonymize or aggregate data where possible and comply with applicable laws and regulations in the regions you serve.
Practical tools to support these methods include survey platforms (for example, form-based surveys and NPS tracking), customer experience software, and social listening tools. Pair surveys with CRM or ticketing systems to close the loop by assigning follow-up tasks to the right teams and logging actions taken in response to feedback.
Common Feedback Themes
When travelers share feedback about bus travel, several common themes tend to emerge: punctuality and reliability, the comfort and cleanliness of seats and interiors, the ease of ticketing and the value of fares, the usefulness of rider information and real‑time updates, safety and the professionalism of drivers, and the accessibility of services for all riders, including those with mobility needs.
Punctuality and Schedule Adherence
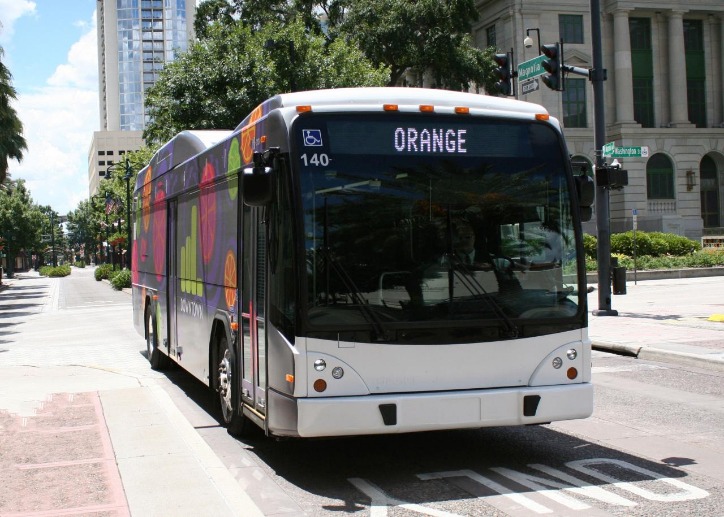
Bus travel feedback often centers on punctuality and schedule adherence as the core determinants of a positive or negative rider experience.
Common feedback themes around bus services include on-time performance, reliability during peak periods, the consistency of service across days, and how well schedules match actual travel times.
Punctuality refers to buses arriving at and departing from stops near the published times, while schedule adherence measures how closely the service follows the timetable, including headways, dwell times, and any detours or route changes.
Riders frequently point to delays caused by traffic congestion, road works, incidents that require detours, vehicle breakdowns, weather conditions, and occasional mis-coordination with transfer connections.
The consequences of poor punctuality extend beyond longer journey times; missed transfers, crowded buses, and uncertainty about the next service can erode trust and encourage riders to seek alternatives.
Improvements often come from better data and operations: real-time tracking and clear live information, proactive maintenance for vehicles, dedicated bus lanes or priority signals, optimized headways with buffers, and robust contingency plans for disruptions.
Feedback collection helps guide these changes. Riders can share experiences via apps, online forms, customer service lines, or social media, including trip numbers, exact times, stops, dates, and the nature of the delay to help pinpoint issues.
By combining consistent feedback with targeted improvements, transit agencies can raise punctuality, strengthen schedule adherence, and deliver a more reliable and predictable bus experience for all travelers.
Comfort and Cleanliness
Bus travel feedback often highlights several recurring themes, with comfort and cleanliness standing out as the most influential factors in the rider experience. These two areas shape whether a trip feels easy and pleasant or frustrating and tiring, even when schedules and routes are solid.
Across routes and operators, common themes include punctuality and schedule reliability, seating quality and legroom, ease of boarding and alighting, luggage storage, onboard amenities such as Wi‑Fi and power outlets, accessibility for riders with mobility needs, safety and driver courtesy, and clarity of fares and routes. When these elements align with passenger expectations, satisfaction tends to rise; when they miss the mark, complaints often point to frustration that can overshadow other positives.
Comfort features frequently mentioned include seat padding and support, adequate back support, seat width and legroom, and the ability to recline without disturbing fellow passengers. Riders also look for consistent climate control, quiet cabins, minimal motion or vibration, and a stable ride. Access to convenient amenities like accessible seating areas and sufficient space for personal items further contributes to a comfortable journey.
For longer trips, travelers emphasize the importance of a smooth ride, steady temperature, and reasonable levels of noise. They value reliable rest areas or timely stops, clean and functional restrooms, and opportunities to stretch legs. Availability of charging ports, reliable Wi‑Fi, and clear information about stop locations also influence comfort on extended hops.
Cleanliness concerns frequently center on interior upkeep: clean seats and floors, absence of stains or odors, tidy overhead shelves and aisles, and quick removal of trash between trips. Restroom cleanliness, replenishment of supplies, absence of unpleasant smells, and well‑stocked sanitizing products are commonly reported as essential. High‑touch surfaces and overall air quality, including ventilation and filtration, also matter a great deal to passengers.
Operators use feedback to drive improvements by increasing cleaning frequency and refining routines, investing in newer buses with better seating and suspension, upgrading HVAC systems, and ensuring reliable power outlets and connectivity. Training staff on courtesy and clear communication, as well as adjusting routes or boarding procedures to reduce crowding, are other common responses to passenger input.
To share feedback effectively, riders are encouraged to be specific about the trip details—bus number, route, time, seat location, and exact issues or moments of good service. Submitting responses through surveys, mobile apps, or customer service channels helps operators identify patterns and prioritize improvements that enhance comfort and cleanliness on future journeys.
Driver Behavior and Safety
Feedback from bus riders is a critical input for operators aiming to improve safety, reliability, and comfort across routes.
Common feedback themes include punctuality and reliability, comfort and cleanliness, accessibility for riders with mobility needs, and clarity of fare information and route announcements. Riders often point to crowding during peak times, the availability of seating, legroom, and the condition of seats and flooring. Clear communication about delays, detours, and changes to service is also frequently requested to help riders plan their trips.
Many riders report on-board experiences that influence whether a trip feels safe or stressful. Positive feedback highlights smooth acceleration and braking, clean and well-lit interiors, functional temperature control, and quiet cabins. Negative feedback often focuses on abrupt starts or stops, cramped spaces during busy periods, unpleasant smells, and dirty or worn interiors that detract from the travel experience.
Driver behavior is a central driver of rider satisfaction and safety. Riders value courteous, patient interactions, helpfulness with boarding or alighting, and clear, respectful communication about delays or route changes. A driver who maintains a safe following distance, observes speed limits, adheres to traffic rules, and uses turn signals consistently tends to earn higher safety ratings in feedback surveys.
Safety-specific feedback frequently touches on emergency procedures, the visibility and availability of safety equipment, and the handling of boarding and alighting near traffic or busy curb spaces. Riders appreciate well-maintained brakes and tires, properly functioning doors, effective crowd management on crowded routes, and clear announcements about safety reminders and incident reporting processes.
Transit agencies use this feedback to drive improvements such as targeted driver training, revised route planning, and enhanced maintenance scheduling. Real-time information systems, updated wayfinding, and improved accessibility features can address many common concerns. Investments in newer, safer buses with better seating, air quality, and passenger amenities also respond to rider priorities.
To provide constructive feedback, riders should share details such as the date and time, route and vehicle number, a concise description of the issue, and any relevant photos or records. Feedback channels include mobile apps, official websites, customer service lines, and on-bus feedback forms. Clear, specific information helps operators diagnose problems quickly and track progress over time.
Ticketing and Fare Systems
Riders share feedback about bus travel focusing on reliability, value, and the ticketing experience, and these themes guide service improvements and fare policy discussions.
Common themes include reliability and punctuality, where on-time performance, unexpected delays, detours, and the accuracy of published schedules shape perceptions of overall service quality.
Another frequent topic is service frequency and coverage, including how often buses run during peak and off-peak times, how well routes connect key destinations, and whether crowding or load factors affect comfort and safety.
Passengers also comment on cleanliness, vehicle condition, comfort of seating, accessibility for wheelchairs or strollers, and driver behavior, including helpfulness and adherence to safety rules and accessibility needs.
Information and communications are often discussed, such as the clarity of route maps, signs at stops, real-time arrival updates, app reliability, and how disruptions are communicated to riders.
Ticketing and fare systems generate feedback about payment methods, ease of use, and price fairness, including the availability of cash, contactless payments, mobile apps, smart cards, and the simplicity of transfers between services.
Pricing structures, transfers, concessions, and discounts for students or seniors are frequent points of debate, along with how easy it is to understand fares, apply discounts, and obtain refunds or replacements for lost or expired passes.
Feedback often touches on the interoperability of fare systems with other modes of transport, such as rail or metro, and how integrated tickets or multi-ride passes affect travel planning and total costs.
Beyond policies, riders provide input on how agencies respond to feedback, including changes to timetables, route adjustments, added peak services, revised fare rules, and new digital tools or customer support options that improve the user experience.
To improve the ticketing experience, best practices include simple and transparent pricing, clear signage and terms, reliable real-time information, inclusive design for diverse riders, multilingual support, and robust digital and offline payment options with privacy protections.
Ultimately, constructive rider feedback helps agencies calibrate routes, schedules, and fares to better match demand, promote fairness, and create a bus system that is affordable, reliable, and easy to use for everyone.
Information and Communication
Bus travelers frequently share feedback about how information is shared before and during trips, and about how well operators communicate changes to service. This article highlights common feedback themes and practical approaches to information and communication in the bus network.
Common feedback themes include timeliness and reliability, clarity of schedules and routes, accuracy of real-time updates, and the usefulness of ticketing and pricing information. Passengers also comment on the readability and accessibility of information, including the availability of translations, large-print materials, and clear announcements. Another frequent topic is how disruptions are communicated and handled, such as delays, detours, or cancellations, and how quickly and transparently passengers are informed.
Timeliness and reliability are often the most visible issues. When buses arrive late or miss connections, travelers question the reliability of the service and the credibility of posted schedules. Conversely, consistent on-time performance tends to reduce frustration even if other aspects of information could be improved. Passengers also value accurate route information that reflects actual stops, deviations, and service levels, so discrepancies between maps and on-bus reality are a common source of criticism.
Information channels are another key focus. Clear, consistent information should be available at stops, online, and on board. This includes printed timetables, route maps, digital displays, and audible announcements. Real-time updates via mobile apps, SMS alerts, emails, and social media can significantly improve the travel experience when they are timely and accurate. When information is missing or outdated across channels, passengers lose trust and may miss connections or choose alternative transport.
Communication during disruptions matters just as much as routine information. Passengers want proactive notices about delays, detours, service changes, and expected recovery times. They appreciate guidance on alternative routes, nearby stops, and how to rebook or rejoin the service. Delays communicated late, with vague or conflicting messages, generate frustration and erode confidence in the operator’s ability to manage incidents.
Language accessibility and inclusivity are frequently raised in feedback. Information should be available in multiple languages where appropriate, and formats should support diverse needs, including visual, audio, and textual options. Clear language, consistent terminology, and user-friendly layouts help all riders understand schedules, fare rules, and service changes quickly.
Information and communication improvements often involve a combination of processes and technology. Standardizing how information is published across channels, delivering real-time data where possible, and maintaining accuracy are foundational steps. Training staff and on-board crews to deliver clear announcements and respond to common questions can reduce confusion. Establishing formal feedback loops—where passenger comments lead to concrete updates—helps services evolve in line with rider needs.
In practice, best results come from timely, accurate, and accessible information delivered through multiple, coordinated channels. Clear announcements on vehicles, up-to-date display screens at stops, reliable digital tools, multilingual support, and transparent communications during disruptions together create a smoother, more trustworthy travel experience for bus riders.
Impact of Feedback on Services
Feedback from bus riders shapes how services evolve, turning passenger experiences into real improvements. By listening to comments about punctuality, seating comfort, safety, accessibility, and fare clarity, operators refine timetables, upgrade vehicles, enhance cleaning, and adjust routes. Across surveys, on-board prompts, and digital reviews, transit agencies translate input into measurable actions that boost reliability and overall traveler satisfaction.
Service Improvements
Feedback from riders is a vital engine for improving bus services. When operators listen to what passengers experience—timeliness, comfort, safety, accessibility—they can target changes that deliver real value.
Across channels like in-app surveys, paper comment cards on buses, SMS feedback, and social media, feedback provides data points about everyday journeys.
The impact areas include timetable reliability, route planning, frequency during peak hours, real-time information at stops and on apps, vehicle cleanliness, seating and accessibility for wheelchair users and parents with strollers.
When feedback highlights delays or overcrowding, operators may rebalance schedules, add buses to busy routes, adjust dwell times, or redesign routes to shorten trips.
Feedback also drives investments in technology: improved real-time arrival boards, mobile apps for fare, trip planning, and outage notices.
A well-managed feedback process creates a constructive loop: collect input, analyze, act, and report back to riders about what changed and why.
Benefits include higher rider satisfaction, increased trust, fewer complaints over time, and better service utilization when riders feel heard.
Challenges include ensuring representative feedback, prioritizing limited resources, and communicating complex decisions clearly. Anonymous feedback can help or hinder truthfulness.
Best practices: close the loop with timely responses, publish impact dashboards, pilot changes before full rollout, and involve community groups in planning.
For bus networks, feedback-driven service improvements lead to safer, faster, more comfortable journeys and stronger rider loyalty.
Route Optimization
Feedback from bus riders is a powerful driver of both service quality and route efficiency. When agencies listen to passenger experiences and concerns, they uncover where late or crowded trips occur, which stops have accessibility gaps, and how information about schedules and delays is received in the community.
Impact on services includes improvements to punctuality and reliability, better bus frequency during peak times, and more accurate travel information for riders. Passenger input also highlights accessibility needs, such as step-free access, seating for seniors, and clearer announcements, which can lead to better-equipped vehicles and staff training. By addressing complaints quickly and openly, agencies can boost trust and encourage riders to continue using public transport.
In terms of route optimization, rider feedback helps identify demand patterns that data alone might miss. Patterns like higher demand along certain corridors during specific hours, under-served neighborhoods, or the need for connections to rail or metro lines become clearer. This information supports route adjustments, the creation of express services, revised dwell times, and improved balancing of network coverage to reduce crowding and shorten travel times for the most-used routes.
Turning feedback into action involves a structured loop: collect diverse rider input, analyze trends, prioritize changes based on impact and feasibility, implement pilots, monitor outcomes, and communicate results back to riders. Integrating feedback with other data sources such as smart card transactions, vehicle GPS, and crowding sensors helps validate rider insights and guide decisions about timetables, headways, and stop placements.
Measures of success include higher rider satisfaction, improved on-time performance, increased ridership, and cost-effective service changes. Real-world examples include adding a new express service during morning peaks, extending service later on weekends in busy corridors, or re-routing buses to serve underserved neighborhoods while maintaining core connectivity to transit hubs. A transparent feedback loop builds trust and encourages ongoing participation from the traveling public.
Fleet Upgrades
Feedback from bus travelers plays a crucial role in shaping the quality of services and guiding fleet upgrades. Passenger insights help transit agencies identify pain points, prioritize investments, and measure the impact of changes over time.
- Service improvements: feedback highlights delays, crowding, and reliability issues, prompting schedule adjustments and better contingency planning.
- Fleet upgrades: data on wear, reliability, and accessibility informs purchasing decisions, such as low-floor buses, better climate control, USB charging, and step-free access.
- Route and timetable optimization: rider input helps reconfigure routes, tweaking frequencies and times to match demand and reduce transfers.
- Maintenance and reliability: feedback flags maintenance needs, enabling proactive servicing and longer bus lifespans.
- Safety and accessibility: comments about lighting, signage, seating, and accessibility features drive improvements for all users, including riders with mobility challenges.
- Experience and communication: transparent responses to feedback build trust and encourage ongoing dialogue between riders and operators.
- Environmental and efficiency outcomes: feedback correlates with fuel efficiency efforts, electrification pilots, and emissions reduction measures.
Ultimately, the impact of feedback is measured not only by immediate fixes but by the ongoing cycle of listening, acting, and communicating results to riders.
Case Studies
Case studies in English explore how bus travel feedback is gathered, interpreted, and acted upon. By examining passenger reviews, surveys, and on-board observations, these studies reveal how feedback shapes routes, schedules, and service quality. The aim is to turn passenger voices into concrete improvements that enhance everyday bus experiences.
Urban Bus Network Feedback Case
Case studies of urban bus networks that actively collect and respond to rider feedback illustrate how passenger voices shape service design, operations, and policy. These studies examine how feedback loops influence route planning, frequency, reliability, affordability, and overall rider experience in crowded cities.
Common methodologies across cases include onboard and web surveys, QR-code linked feedback forms, mobile apps for real-time issues, social media monitoring, and the integration of automated counters and travel-time data. An effective study triangulates qualitative comments with quantitative metrics such as on-time performance, dwell times, occupancy, and headways.
Case Study: City Alpha focused on speed and reliability in a congested downtown corridor. By implementing bus signal priority, revised stop spacing, and a new limited-stop express route, the network reduced dwell times and improved travel times. On-time performance rose from 72% to 88%, average speed increased from 12 km/h to 16 km/h, and rider satisfaction scores climbed by double digits within a year.
Case Study: City Bravo examined equity of service. Mapping gaps in coverage revealed under-served neighborhoods without late-evening options. The city introduced two new night bus lines and expanded weekend service where needed. Coverage increased by 15%, riders in low-income districts reported greater access, and observed ridership in targeted areas grew by 25% in 18 months.
Case Study: City Delta piloted a digital feedback platform that allows riders to rate comfort, crowding, cleanliness, and safety, and to flag incidents in real time. Data were complemented with driver logs and smart-card tap data. Through sentiment analysis and rapid response loops, complaints about crowding decreased by 40% and scheduling adjustments reduced peak-period crowding by 10–15%, improving perceived reliability.
Across these cases, several challenges recur: ensuring sample representativeness in surveys, avoiding response bias, translating feedback into actionable changes, and aligning short-term improvements with long-term budgets. Data privacy and resource constraints also influence what feedback can be collected and acted upon.
Best practices emerge when feedback is embedded in governance: establish clear ownership for feedback programs, publish regular performance reports, run pilots before large-scale change, and involve riders in co-design sessions. Linking passenger comments to operational data helps validate priorities and justify investments.
Ultimately, bus travel feedback underpins more rider-centered urban mobility. Case studies show that measurable improvements in reliability, coverage, and experience stem from transparent feedback loops, data-driven decisions, and sustained collaboration among transit agencies, operators, and communities.
Rural Route Feedback Case
Case studies illuminate how passenger feedback on rural bus routes informs service design and operations, turning voices from small communities into practical changes that improve reliability and accessibility for everyone who depends on public transport outside urban centers.
The Rural Route Feedback Case examines how a regional transport authority collected and analyzed input from riders on sparsely populated lines to shape timetables, stop locations, and service levels. Set in a county with dispersed settlement patterns and seasonal travel demands, the case demonstrates both the value of listening and the complexity of turning feedback into affordable, concrete improvements.
Feedback channels were deliberately varied to reach a broad cross-section of riders. In-vehicle surveys captured real-time impressions from daily commuters, while paper feedback forms were distributed at libraries, community centers, and post offices for residents who preferred offline methods. A toll-free phone line and a text-based SMS survey provided accessible options for older riders and those with limited internet access. An online portal allowed more tech-savvy users to submit comments and vote on proposed changes. Community meetings and listening sessions were held quarterly, often in a local school gym or community hall, to gather qualitative input and explain how feedback would be used.
The data from the Rural Route Feedback Case showed several recurring themes. Riders emphasized reliability and predictability—the value of knowing when to expect a bus, rather than simply how often a bus ran. Access barriers such as the distance to stops, the condition of sidewalks, and the availability of shelter in harsh weather were repeatedly mentioned. Many users highlighted the need for better connections to regional hubs, medical facilities, and schools, especially for families and elderly residents who relied on a single daily trip to reach essential services. Seasonal patterns emerged clearly, with tourist influxes in summer and harvest-season peaks altering ordinary demand, sometimes creating gaps in service at critical times.
Based on the feedback, the agency implemented a sequence of trial changes in a staged approach. One result was a revised timetable that bundled morning and afternoon trips to match reported peak demand windows, alongside shorter, demand-responsive runs in the least busy midday period to preserve overall coverage without creating excessive deadhead miles. Stop locations were reviewed, with a focus on reducing walking distances for vulnerable riders, improving ADA-compliant access, and installing sheltered waiting areas where feasible. A pilot on a rural corridor introduced a limited on-demand microtransit option during off-peak hours to cover sparsely used segments without maintaining full routes year-round.
Early evaluations of the changes showed mixed but encouraging signals. Overall ridership on core routes stabilized after a decline, and user satisfaction scores improved for reliability and accessibility. Specifically, wait times during peak periods shortened by an average of 12 to 15 minutes on adjusted services, while rider-reported confusion about timetables decreased as improved printed schedules and clearer signage were deployed. The on-demand pilot attracted users who previously avoided the service due to perceived inconvenience, helping maintain coverage in areas where fixed-route economics were challenging. The authority tracked cost per rider and compared it with access benefits to ensure the adjustments remained financially viable over the medium term.
A second case, the Riverbend County Rural Accessibility Case, highlighted a different set of considerations, focusing on seniors, people with disabilities, and caregivers. Feedback from disability groups prompted improvements to curb-to-bus access, the addition of low-floor vehicles, and better coordination with medical transport programs. After implementing a transportation coordinator role to bridge gaps between social services and transit operations, the county reported fewer missed medical appointments attributed to transit delays and a measurable rise in patient satisfaction with the mobility options available to them. This case underscored the importance of integrating transit feedback with broader social support services to deliver a more cohesive mobility ecosystem for rural residents.
Across both case studies, several common lessons emerged for bus travel feedback in rural settings. First, successful programs used a mix of quantitative data and qualitative insights, ensuring numbers reflected lived experiences and vice versa. Second, engagement required ongoing commitment rather than one-off surveys; regular updates about which suggestions were adopted helped maintain trust and continued participation. Third, diversity of input mattered: translating materials, providing access options for hearing and visually impaired riders, and offering meetings in multiple locations encouraged broader participation. Fourth, changes needed transparent communication about trade-offs, such as balancing coverage with operating costs, to set realistic expectations in small communities.
From these experiences, best practices for rural route feedback in bus travel include establishing a formal feedback loop with defined timelines for reviewing input, documenting decisions, and reporting back to the community. Use multiple channels to reach different user groups, including in-vehicle surveys, paper forms, hotlines, and online portals, while ensuring accessibility and language inclusivity. Pilot targeted changes on a limited scale before broader rollout, and measure both the reliability metrics and the user experience to capture the impact. Finally, integrate transit feedback with broader community planning, aligning improvements with social services, education, and healthcare access to maximize the societal benefits of rural bus travel feedback.
Best Practices for Collecting High-Quality Feedback
Collecting high-quality feedback is essential for improving bus travel experiences. This article outlines best practices for gathering clear, actionable input from riders, including designing concise surveys, ensuring anonymity, asking specific questions about routes, schedules, seating, cleanliness, and safety, and choosing channels that reach both frequent riders and occasional travelers. By focusing on unbiased questions, proper timing, and transparent follow-up, transit operators can turn feedback into tangible service improvements and higher customer satisfaction.
Crafting Clear Questions
Timing and Frequency
Ensuring Anonymity and Trust
Collecting high-quality feedback from bus riders is essential to improving service, safety, and reliability. When riders trust that their input is anonymous and used to make real improvements, they provide more honest and constructive responses that reveal true experiences on routes, at stops, and with onboard staff.
Define clear goals and use a representative sampling plan. Decide whether you want feedback on punctuality, seating comfort, cleanliness, safety, driver courtesy, fare handling, or accessibility. Use random sampling across multiple routes, times of day, and days of the week to avoid skew toward a single group of riders. Set target response rates and minimum sample sizes that are statistically meaningful for the scope of your service area.
Offer multiple channels and timely prompts. Combine in-vehicle prompts with digital options such as survey links sent by SMS or email, QR codes displayed on buses, and a mobile-friendly web form. Prompt riders shortly after a trip when memories are fresh, and avoid asking for feedback during peak stress moments. Ensure accessibility for riders with disabilities by providing screen-reader friendly forms and options for audio or large-print formats.
Design questions that are actionable and unbiased. Use a mix of close-ended items with Likert scales for consistency and open-ended prompts for context. Include essential trip identifiers such as route or bus number, date, and approximate time to help teams locate issues, but avoid collecting personal identifiers that could identify individual riders. Example items: rate punctuality, comfort of seating, cleanliness, driver professionalism, ticketing and fare experience, and safety perceived on the vehicle. Good open-ended prompts include: “What helped you have a smooth ride today?” and “What changed your experience on this trip, and why?”
Protect anonymity and minimize data collection. Do not require name, contact details, or other identifying information. If you collect optional demographic data to understand rider segments, separate it from feedback data, store it with restricted access, and aggregate results before analysis. Do not link feedback to device identifiers or location histories in ways that could re-identify a rider. Use data minimization: collect only what you need to measure and improve service.
Communicate a clear privacy policy and data usage plan. Provide a concise statement that explains why you are collecting feedback, how the data will be used, who can see it, where it will be stored, how long it will be kept, and how anonymity will be preserved. If third parties help administer the survey, name them and describe their role. Make the policy easy to find and easy to understand, in plain language and multiple languages common among riders.
Build trust through transparency and control. Tell riders that their responses are aggregated for reporting and that individual comments will not be shared publicly in a way that reveals identity. Offer opt-out options and a clear route to ask questions about data handling. Provide contact information for a privacy liaison or survey administrator so riders know how to raise concerns.
Prioritize accessibility and inclusive language. Use simple, non-technical wording and avoid jargon. Provide translations for languages spoken by the majority of riders on your network. Ensure color contrast, scalable text, and alternative text for any visual elements in digital forms. Test surveys with a diverse group of riders to identify barriers to participation.
Be mindful about incentives and participation dynamics. If you offer incentives for completing surveys, ensure they do not bias responses or pressure riders to answer a certain way. Consider modest, time-limited rewards or entry into a drawing rather than guaranteed benefits tied to specific answers. Emphasize that honest feedback—positive or negative—drives real improvements.
Close the loop by acting on findings and reporting back. Establish a quick-turnaround process to triage urgent safety concerns and longer-term trends. Publish a concise, anonymized summary of results and actions taken on a routine cadence (e.g., monthly or quarterly), and acknowledge rider input in those updates. Highlight specific changes, such as adjustments to schedules, maintenance practices, or staff training, to demonstrate the value of feedback.
Ensure data quality with structured analysis and ongoing improvement. Code qualitative comments to identify recurring themes (delay causes, crowding, cleanliness, etc.) and track trend lines over time. Use dashboards that surface route-level issues alongside fleet maintenance insights. Regularly review sampling bias, response rates, and question wording to refine the survey design for better precision.
Integrate feedback into operations and culture. Link learning from rider feedback to concrete operational changes, staff training programs, and procurement decisions. Involve frontline teams in feedback reviews to turn insights into practical improvements on buses and at depots. Recognize and celebrate improvements driven by rider input to reinforce trust and continued participation.
Using Feedback to Measure Performance
Using feedback from bus riders helps transit agencies measure performance beyond schedules by turning customer experiences into concrete metrics. Through comments, ratings, and brief surveys, on-time reliability, wait times, crowding, cleanliness, and accessibility become measurable signals that guide targeted improvements in routes, frequencies, and service quality.
Key Performance Indicators (KPIs)
Using feedback to measure performance in bus travel means listening to riders, interpreting their comments, and turning that input into clear metrics that guide operations. KPIs, or key performance indicators, provide a concise way to translate feedback into actionable performance targets.
Feedback helps choose the right KPIs, ensures they reflect rider experience, and reveals where the service meets or misses expectations. A robust feedback program collects comments from riders, drivers, and maintenance staff, then links those insights to specific operational metrics.
Typical KPIs for bus travel include on-time performance, headway reliability, trip completion rate, and service coverage. Other important indicators are rider satisfaction, net promoter score, wait times, vehicle cleanliness, safety incidents, and accessibility for people with disabilities.
To collect feedback, use multiple channels: on-board surveys or touchscreen polls, QR codes that link to quick surveys, post-ride emails, in-app ratings, social media monitoring, and feedback hotlines. Make surveys short, standardized, and possible to respond quickly, while leaving room for open comments.
Link feedback to KPIs by mapping rider comments to categories such as punctuality, comfort, safety, and value. Establish baselines for each KPI, set targets, and track performance over time. Build dashboards that show both rider feedback scores and operational data like OTP and dwell time so teams can see correlations.
Implement a closed feedback loop: collect data, analyze trends, identify root causes, implement corrective actions, and verify impact. Assign owners for each action, set deadlines, and report progress in regular reviews. Use pilot changes to test improvements before scaling.
Example: if riders complain about long wait times during peak hours, correlate feedback with headway reliability and OTP. Adjust bus frequencies, run a few additional trips, or tweak layover times. Measure the effect on CSAT or NPS, OTP, and rider perceived wait time to confirm impact.
Data quality and privacy matter. Ensure feedback is representative by sampling riders across routes and times, handle personally identifiable information with care, and document data sources and methods. Use data normalization and remove duplicate responses to avoid bias.
In summary, using feedback to drive KPIs helps bus operators improve reliability, rider satisfaction, and efficiency. When feedback is embedded in a disciplined performance management process, teams can react quickly, learn continuously, and deliver a better travel experience for riders.
Benchmarking and Targets
Using feedback to measure performance in bus travel starts with listening to riders and translating their experiences into actionable metrics. Feedback helps transform subjective impressions into benchmarks and targets that guide service improvements and resource allocation.
Collect feedback through multiple channels to capture a representative view: on-board surveys, mobile apps, SMS or email feedback forms, in-station kiosks, call centers, and monitoring of social media and review platforms. Encourage honest comments about reliability, comfort, safety, accessibility, and value for money.
Key performance indicators for bus travel include on-time performance, headway adherence, route reliability, cancellations, delays, dwell time at stops, service coverage, and accessibility. Operational data from GPS, automatic vehicle location, and fare systems should be integrated with feedback to provide a complete picture of both efficiency and rider experience.
Rider experience metrics such as customer satisfaction (CSAT), Net Promoter Score (NPS), and customer effort scores (CES) are essential. Sentiment analysis from comments can reveal drivers of dissatisfaction, while post-ride surveys or quick polls after trips help track changes over time.
Benchmarking is the process of comparing performance against internal historical data and external peers. Internal benchmarks might compare routes or time periods (weekday vs weekend) to identify persistent gaps. External benchmarking compares against similar cities or national standards to set aspirational targets and learn from best practices in the sector.
Targets should be SMART: specific, measurable, achievable, relevant, and time-bound. For example, target on-time arrivals within a two-minute threshold on 90% of weekday trips over the next 12 months, or reduce rider-reported interruptions by 15% within a 9-month period.
Data integration is crucial. Combine operational data (GPS, dwell time, dwell counts, cancellations) with feedback data to create dashboards that show the relationship between rider sentiment and service performance. Dashboards should enable planners, operations staff, and frontline supervisors to track progress and identify where to invest resources.
Closing the feedback loop means taking targeted actions in response to rider input. Priorities should be set by impact and feasibility. Examples include adjusting schedules to reduce slack time, retraining drivers on dwell-time management and safe boarding, increasing cleaning frequency, upgrading bus interiors, expanding accessibility features, and improving real-time travel information at stops and via apps.
Case in point: a city bus network benchmarked late arrivals against peak-hour performance and implemented targeted schedule tweaks and maintenance regimes. Within six months, late arrivals declined by 18%, while rider satisfaction score improved by several points, validating the value of benchmarking and target setting.
Challenges to anticipate include data quality gaps, response bias, seasonality, and privacy considerations. Mitigation strategies include randomized sampling for surveys, balancing feedback across routes and times, anonymizing responses, and ensuring transparent communication about how feedback influences service decisions.
In summary, feedback-driven measurement with clear benchmarks and ambitious yet realistic targets enables bus travel providers to improve reliability, rider satisfaction, and overall value. A disciplined approach to collect, analyze, and act on feedback turns rider voices into measurable performance gains.
Challenges and Risks
Bus travel feedback presents a range of challenges and risks for transit teams, from capturing diverse rider experiences to accurately interpreting complaints about delays, safety, and comfort. Ensuring clear, accessible feedback channels and protecting rider privacy helps gather reliable data, while avoiding bias and underrepresentation is essential to fair improvements. Awareness of these pitfalls is the first step toward translating feedback into safer, more reliable, and passenger-friendly bus service.
Response Bias
Collecting feedback from bus riders helps transit agencies improve routes, schedules, comfort, safety, and customer service. But achieving representative, reliable insights is challenging because respondents are not a random sample of all riders and experiences vary by time, route, and user group.
Response bias occurs when the people who respond differ from the broader rider population. Online surveys may attract younger or more tech-savvy riders, while others—such as older passengers, those with limited internet access, or non-English speakers—are underrepresented. This distorts the picture of overall satisfaction and needs.
Self-selection bias can exaggerate extreme experiences, with both very positive and very negative riders more likely to respond than average riders. This can inflate the perceived intensity of issues or praise, leading to priority mistakes in service changes.
Social desirability bias may cause riders to refrain from criticizing safety or conduct issues in public or official channels, preferring to provide polite feedback. Recall bias also matters when feedback is asked after a long trip or after an event, reducing accuracy about times, delays, or specific incidents.
Language and accessibility bias matters for equity: surveys that only use a single language or text-based formats exclude non-native speakers, visually impaired riders, or those with literacy barriers, skewing results away from vulnerable groups who may experience the greatest service gaps.
Operational risks include misinterpreting data leading to misallocated resources, overreacting to vocal minorities, or missing systemic patterns that appear only in certain routes or times. Relying on a single data source increases the chance that feedback drives changes that do not reflect overall rider experience.
Mitigation strategies include using mixed methods (online surveys, paper forms, in-station intercepts, focus groups, and short on-vehicle prompts) to reach diverse riders; applying stratified sampling and weighting to reflect rider demographics and usage patterns; translating surveys into common local languages; ensuring accessibility with large print, screen-reader friendly formats, and audio options; neutral question wording; avoiding leading scales; piloting instruments; and triangulating feedback with objective metrics like on-time performance, crowding, and maintenance data. Transparent reporting of response rates and limitations helps stakeholders interpret results responsibly.
In practice, building a feedback program that acknowledges biases while actively broadening representation creates more reliable insights to guide service improvements, equitable access, and rider trust in transit planning.
Data Privacy
Feedback collected from bus travelers is a powerful tool for improving routes, timetables, and onboard services, but it also brings significant challenges and risks around data privacy. Operators must balance the desire for actionable insights with the obligation to protect the personal information of riders, drivers, and staff who may be mentioned in comments or logs. The channels for feedback—mobile apps, kiosks, email surveys, or social media—often generate data that extends beyond simple ratings to include location, travel history, and device identifiers, creating a complex privacy landscape to navigate.
Key challenges in gathering bus travel feedback include ensuring representative participation, avoiding bias, and maintaining data quality. Digital surveys may overrepresent tech-savvy travelers, while in-person feedback at depots may miss late-night or long-distance riders. Multilingual and accessible formats are necessary to capture diverse rider experiences, but they complicate data processing and translation. Additionally, feedback can contain unstructured and sensitive information, such as complaints about accessibility needs, safety concerns, or medical conditions, which requires careful handling and appropriate privacy safeguards.
There are real privacy risks if feedback data is not managed properly. Personal data can appear in comments or be inferred from travel patterns, such as frequent routes or unique journey times. Even seemingly anonymous data can be re-identified when combined with other records, raising concerns about profiling, targeting, or surveillance. Risks include unauthorized access to dashboards or databases, data leakage through third-party integrations, and the inadvertent disclosure of riders’ identities in public dashboards or reports. Operators must consider whether location or travel history is stored, and for how long.
Regulatory frameworks such as the European Union’s General Data Protection Regulation and regional privacy laws like the California Consumer Privacy Act shape how bus operators collect, process, and store feedback data. Key requirements include legal bases for processing (often consent or legitimate interest), purpose limitation (data used only for stated goals), data minimization (collecting only what is necessary), and clear data retention schedules. Transparency about how feedback is used, what data is collected, and with whom it is shared helps build trust and supports rider rights such as access, correction, and deletion requests.
Effective data management practices are essential to address privacy concerns. Data minimization means capturing only the data needed to analyze service quality, such as anonymized route identifiers and aggregated performance metrics, rather than full trip logs. Pseudonymization or anonymization of feedback content can reduce identification risk, while still allowing pattern detection and sentiment analysis. Access controls should enforce the principle of least privilege, with role-based permissions for customer service, operations, and analytics teams. Clear data retention policies specify how long feedback data is kept and when it is securely erased.
Security measures are a critical line of defense against privacy breaches. Encryption for data at rest and in transit, secure API practices for third-party integrations, and regular security testing help protect feedback systems from unauthorized access. Incident response planning, including breach notification procedures and user communications, is essential to minimize harm if a data incident occurs. Vendor risk management is also important when third-party analytics platforms or cloud services are involved, including due diligence, contractual protections, and ongoing monitoring.
Sharing feedback data with partners or external analytics providers introduces additional privacy considerations, especially when data crosses borders. Data transfer agreements should specify purposes, retention, deletion, and protections aligned with applicable laws, and where possible data should be aggregated or anonymized before sharing. Operators must be careful not to enable excessive profiling or marketing use of travel data without explicit consent and a transparent opt-out mechanism for riders.
Mitigation approaches include embedding privacy by design into the feedback collection process, conducting data protection impact assessments for new features, and implementing robust data governance. Practical steps include offering clear consent prompts, providing easy ways for riders to exercise their data rights, and maintaining a transparent privacy notice that explains what data is collected, why it is collected, and how long it will be kept. Regular training for staff on privacy responsibilities and ongoing audits of data handling practices further reduce risk and reinforce a culture of data protection in bus travel feedback ecosystems.
Resource Constraints
Collecting and acting on bus travel feedback involves navigating a range of challenges and risks, especially when budgets and staff time are tight. Resource constraints shape what feedback can be heard, how it is processed, and which changes are actually implemented.
Resource constraints in gathering feedback include limited staff to manage surveys and respond to passengers, small budgets for incentives to participate, and the difficulty of reaching riders across all routes, times, and languages.
Response rates and coverage are often uneven. Short-term surveys may miss travelers who ride infrequently, work night shifts, or use kiosks at stops with limited connectivity. Paper forms, phone lines, or in-app prompts may not reach everyone equally.
Data quality and bias are common risks. Self-selected feedback tends to overrepresent dissatisfied riders or highly engaged commuters, while quiet customers remain unheard. Fragmented channels can lead to inconsistent data and duplicate or conflicting inputs.
Relying on feedback to drive service changes can create misalignment with operating realities. Passengers may request improvements that are expensive or technically infeasible, while persistent but less visible issues (like on-time performance) require different metrics to track.
Privacy and trust concerns arise when collecting personal information. Even simple feedback apps may gather location data or contact details. Clear consent, minimization, and secure handling are required to avoid data leaks and comply with privacy laws.
Technology and accessibility constraints matter too. Digital feedback tools assume passengers have smartphones or internet access, which is not universal. Interfaces must be inclusive and available in multiple languages, including accessible design for older riders.
Operational risk comes from acting on feedback without sufficient evaluation. Implementing a large number of low-cost changes may strain maintenance, disrupt schedules, or create inconsistent rider experiences across corridors if prioritization is not clear.
Mitigation and best practices include prioritizing feedback by impact and feasibility, using representative sampling, offering multiple channels (short surveys at stops, QR codes, voice prompts, social listening), and automating triage to route inputs to the right teams. Data should be anonymized, and progress reports shared with riders to build trust.
By recognizing resource constraints upfront and building a disciplined feedback program, transit agencies can turn limited input into meaningful service improvements while managing risk and maintaining accountability.
Future Trends in Bus Travel Feedback
Future trends in bus travel feedback will make rider input quicker, richer, and more actionable. Transit operators are expanding digital channels, real-time surveys, and in-ride prompts, supported by AI analytics that turn comments into concrete service improvements. Closed-loop systems will close the feedback loop, showing riders how their input leads to changes, while a focus on accessibility and privacy keeps participation inclusive and trustworthy.
Real-Time Feedback Platforms
Feedback on bus travel is evolving from periodic surveys to continuous real-time streams, empowering operators to respond quickly and improve service as riders experience it. Real-time feedback platforms are becoming core to transit operations, gathering insights through apps, kiosks, SMS, and onboard interfaces.
Mobile apps and quick-response channels enable riders to rate a trip, report delays, or flag safety concerns within moments of experience. QR codes placed at stops, seated prompts, and digital displays onboard streamline the feedback flow and reduce friction for riders to share their views.
Advances in natural language processing and sentiment analysis translate free-text comments into actionable signals, categorizing feedback by sentiment, issue type, and severity. This accelerates triage, helps highlight emerging trends, and supports more nuanced responses than simple star ratings.
Location-aware feedback ties comments to specific routes, trips, stops, or even segments of a journey, enabling operators to pinpoint bottlenecks, safety concerns at particular platforms, or discomfort on certain vehicle models.
Integrating feedback with fleet management dashboards allows live adjustments to headways, dispatch decisions, vehicle assignments, and crowd management during peak periods. Real-time insight helps reduce dwell times and improve reliability across corridors.
AI-enabled chatbots and virtual assistants guide riders through post-ride surveys, answer frequently asked questions, and escalate urgent issues to human agents. This keeps feedback channels open 24/7 while maintaining human oversight for critical cases.
Gamification and loyalty features incentivize participation, offering small rewards or recognition for consistent feedback. This approach can broaden participation among occasional riders and help distill a broader set of perspectives.
Platforms are increasingly multilingual and accessible, with support for screen readers, voice input, and high-contrast interfaces. Inclusive design ensures diverse rider groups can share experiences and influence service improvements.
Privacy and data security remain central: transparent consent, data minimization, robust anonymization, clear retention schedules, and options for riders to opt out of certain data collection while still providing essential feedback.
Interoperability and standards are pushing transit ecosystems toward common taxonomies, APIs, and data formats. Seamless integration with municipal data, fare systems, and other mobility services enables holistic insights and coordinated improvements.
From feedback to forecast, platforms are enabling predictive analytics that identify recurring issues, anticipate maintenance needs, and adjust timetables before disruptions occur. This proactive approach helps sustain reliability and rider trust.
Sentiment Analysis and AI
Future trends in bus travel feedback, sentiment analysis and AI are converging to create more responsive, rider-centric networks. Operators are moving toward richer feedback ecosystems that capture passenger experiences across multiple touchpoints and translate them into actionable improvements.
- Real-time feedback channels and micro-surveys integrated into ticketing apps and on-bus screens to capture immediate impressions after trips.
- Advanced sentiment analysis and topic modeling that identify drivers of satisfaction or dissatisfaction (on-time performance, comfort, seating, cleanliness, safety) across languages and dialects.
- AI-powered customer service automation that triages complaints, auto-generates responses, and routes issues to the right operations teams, reducing resolution times.
- Personalization and proactive engagement where models tailor communications, service notices, and offers based on travel patterns and stated preferences.
- Data-driven route and schedule optimization using feedback signals to adjust frequency, stop venues, and crowd management during peak periods.
- Multimodal feedback capture including voice, text, images, and video with robust privacy controls to ensure inclusive rider input from diverse groups.
Accessibility and Inclusion
The future of bus travel feedback is poised to be more inclusive, responsive and data-driven, with rider voices shaping services that are accessible to everyone regardless of ability, age or language.
Digital feedback platforms will expand beyond apps to include SMS, voice assistants, QR codes at stops and on vehicles, and offline modes for riders with limited internet access.
Real-time feedback and analytics will allow transit operators to monitor sentiment, accessibility complaints, and service reliability on live dashboards, enabling rapid fixes and service adjustments.
Accessibility upgrades in buses and stops will include step-free boarding, low-floor designs, ramps, improved wheelchair seating, tactile guiding surfaces, clear audio and visual announcements, high-contrast signage and multilingual wayfinding.
Inclusive design of surveys and channels will offer feedback requests in multiple languages, easy-to-read formats, pictograms and plain-language options, with considerations for neurodivergent users and those with hearing or vision impairments.
Safety, harassment and inclusion will be prioritized through dedicated channels for reporting abuse, on-bus safety features, well-lit spaces, and staff training to foster welcoming environments for riders of all backgrounds.
Privacy and trust will be central as agencies emphasize data minimization, anonymization, consent and transparent explanations of how feedback data is used, with clear options to manage or delete data.
Policy, governance and standards will drive universal design principles, standardized accessibility criteria across fleets and infrastructure, and active citizen participation in planning and procurement decisions.
Emerging technologies will support feedback and inclusion through AI-powered sentiment analysis, multilingual translation, and predictive analytics to anticipate accessibility needs, optimize routes, and allocate resources for underserved communities.
Ultimately, the trend is toward buses that listen more, are easier to use, and welcome all riders, with feedback loops guiding continuous improvement in accessibility and inclusion.